Posts

Showing posts with the label happened

Nifty Anticipated Happened

Image
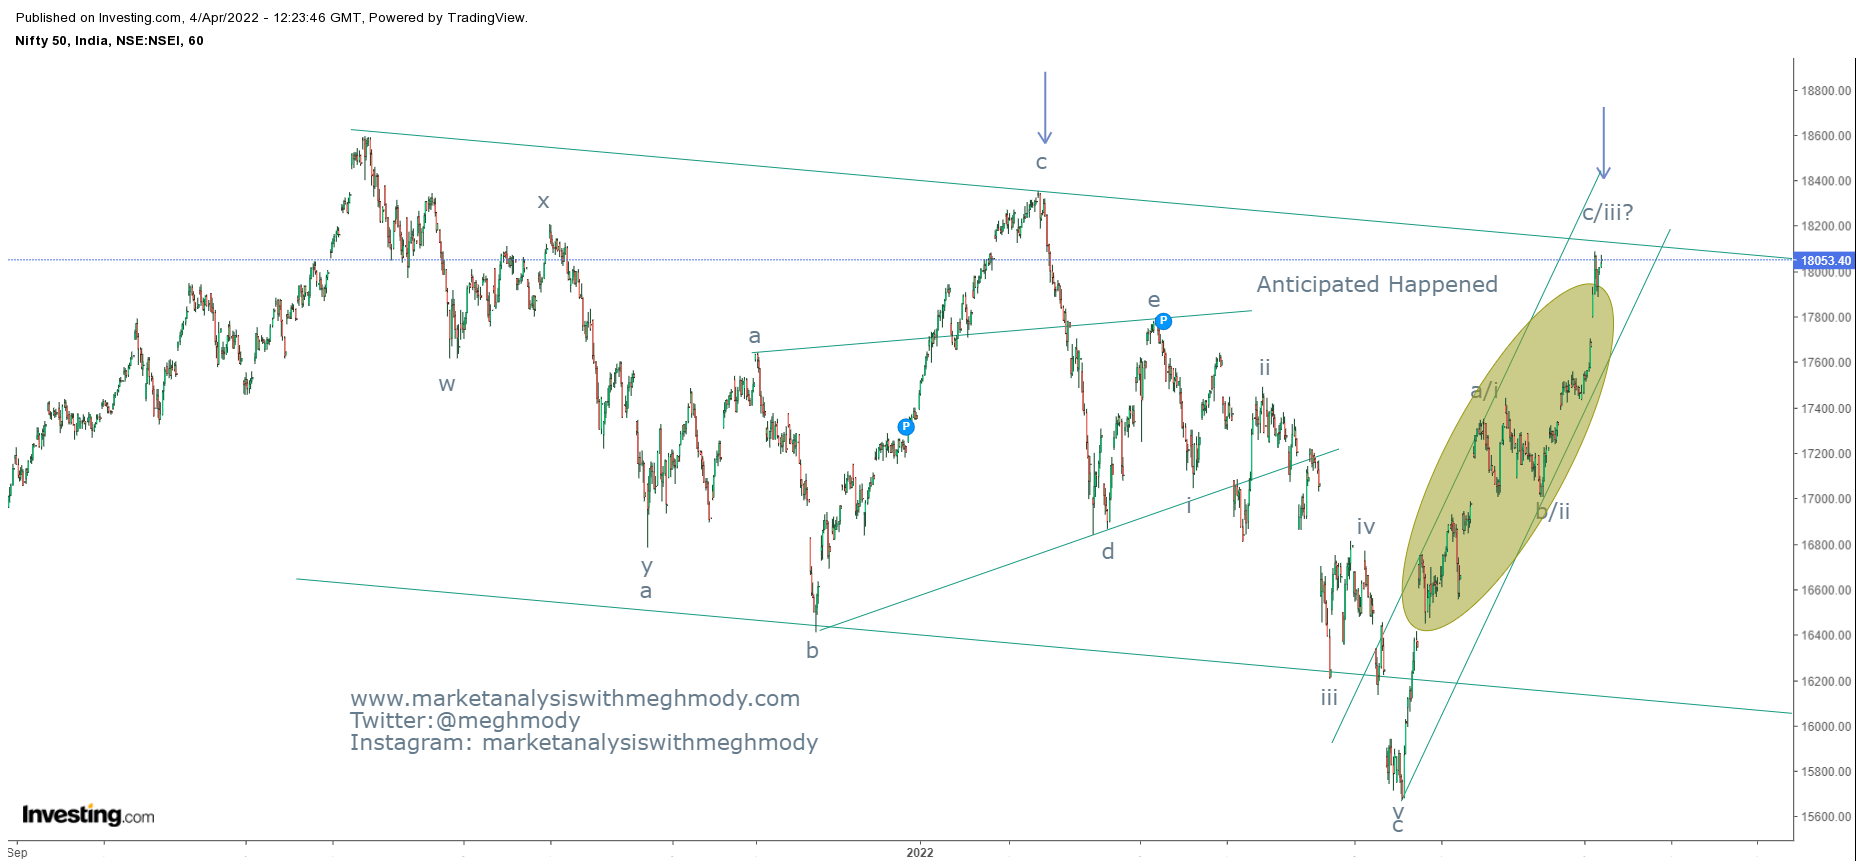
 Nifty 60 mins chart anticipated on 19th April 2022 Nifty 60 mins chart happened on 11th May 2022 In my previous update, I had mentioned, " Nifty can bounce from current levels near till 17200-17400 levels and then it will move back down towards 16200-16000 levels over short to medium term." Nifty bounced and reached the level of 17400 levels from the level of 16800 levels thereby achieving my mentioned level of 17200-17400 levels (highlighted in blue) and from there the index plunged below 16000 levels, thus achieving the levels below (highlighted in yellow) - Anticipated Happened To view my previous article on Nifty, click on the below link https://www.marketanalysiswithmeghmody.com/2022/04/nifty-anticipated-happened-and-elliott.html Prices are at crucial stage as it has arrived near very strong support but at the same time it is early to catch the reversal from here. I will be monitoring the move and update you timely.

Hindalco: Anticipated Happened

Image
Hindalco 60 mins chart anticipated on 22nd April 2022  Hindalco 60 mins chart happened on 5th May 2022 In my previous update, I had mentioned, " Hindalco is negatively poised and can plunge till 480-460 levels over short period of time." The metal stock plunged after completing the bearish head and shoulder pattern and arrived towards my level of 480-460 - Anticipated happened. To view my previous article on Hindalco, click on the below link https://www.marketanalysiswithmeghmody.com/2022/04/hindalco-bearish-head-and-shoulder.html Prices are moving in an impulse fashion in which it is moving in wave iii, this current wave is extension and can further falter with some counter trends taking shape in between. The fall will drag prices towards 445 to 430 levels to complete the impulse wave. The summation is Hindalco is all set to crack further towards 445-430 levels in near term.

Nifty: Anticipated Happened and Elliott Wave Analysis

Image
 Nifty 60 mins chart anticipated on 4th April 2022 Nifty 60 mins chart happened on 19th April 2022 In my previous update on Nifty dated 4th April 2022. I had mentioned that, " Nifty is set to reverse only a move below 17700 is broken which will infuse selling pressure dragging it towards 17000 over short term. However, move above 18160 will continue positivity." Nifty broken the small rising channel and also broke the crucial level of 17700 levels dragging it till 16830 levels - Anticipated Happened. To view my previous article on Nifty, click on the below mentioned link https://www.marketanalysiswithmeghmody.com/2022/04/nifty-anticipated-happened-and-road.html As per Wave analysis, prices are moving in a double correction where after completing wave x at 18090 levels, prices have opened wave a of second correction which can sink its previous low or can come close to its previous low level. However, I think the first correction of wave a is over where I have marked wave a? a

MCX Crude Oil: Revisited

Image
MCX Crude Oil 60 mins chart anticipated on 13th April 2022 MCX Crude Oil 60 mins chart happened on 14th April 2022 In my previous update on MCX Crude Oil I had mentioned that, " MCX Crude Oil is set to soar near till 7950-8000 levels over short term."  Prices after giving a bullish break continued to soar and achieved my mentioned level of 7950-8000 levels on following day - Anticipated Happened I had following the MCX Crude Oil chart and applied Elliott Wave on it and was highly successful in anticipating the fall along with the rise. To view my articles on MCX Crude Oil, click on the below link MCX Crude Oil Anticipated Happened https://www.marketanalysiswithmeghmody.com/2022/04/mcx-crude-anticipated-happened.html MCX Crude Oil: Simple Zigzag pattern https://www.marketanalysiswithmeghmody.com/2022/04/mcx-crude-oil-simple-zigzag-elliott.html As now the trend for the black gold is firmly positive, I will continue to monitor the prices of crude oil to understand if it is impul

MCX Crude: Anticipated Happened

Image
 MCX Crude Oil 60 mins chart anticipated on 1st April 2022 MCX Crude Oil 60 mins chart happened on 11th April 2022 In my previous update on MCX Crude Oil, I had mentioned that, " MCX Crude Oil can test the level of 7155 followed by 6620 levels over short term." I had given two targets in MCX Crude where the first one was achieved as it made a low of 7071 which was 61.8% of wave a to wave b. The second target was 161.8% of wave a to wave b where zigzags can be completed which it did not - Anticipated Happened To view my previous article on MCX Crude Oil, you can click on the below link https://www.marketanalysiswithmeghmody.com/2022/04/mcx-crude-oil-simple-zigzag-elliott.html Prices plunged by over 7.30% in 7 trading sessions and then bounced from cluster of supports breaking the falling trend line resistance and also the falling wedge pattern, both indicates that downtrend is over. As per wave theory, prices have completed wave a wave b and wave c in an ending diagonal patter

Bank Nifty: Anticipated Happened and Elliott Wave Analysis

Image
 Bank Nifty hourly chart anticipated on 9th March 2022 Bank Nifty hourly chart happened on 1st April 2022 In my previous update on Bank Nifty, I had mentioned, " Nifty Bank is positively poised and can move higher from current levels towards 37000-37300 over short term." On 1st April Nifty Bank made a high close to 37200 levels thereby achieving my above mentioned range/level - Anticipated Happened To view my previous article on Bank Nifty, click on the link below https://www.marketanalysiswithmeghmody.com/2022/03/bank-nifty-neo-wave-extracting-triangle.html The index after giving a bullish break in a small falling channel, it started moving higher in a higher highs and higher lows and also arriving near to crucial resistance of the big falling channel. I think prices can move tad higher from here to test the resistance zone. As per Wave theory, prices are moving in wave x, there is a high possibility prices will move close to 37500-37650 levels over very short term which wil

Nifty Metal Index: Anticipated Happened and Elliott Wave Forecasting

Image
 Nifty Metal Index daily chart anticipated on 20th March 2022 Nifty Metal Index daily chart happened on 29th March 2022 In my previous update I had mentioned for Nifty Metal Index that, " Nifty Metal Index is positively poised and can move towards 6570-6750 levels over short term." The index moved well above my first resistance of 6570 and made a high of 6620 levels thereby achieving my mentioned level - Anticipated Happened To view my previous update on Nifty Metal Index, click on the below mentioned link https://www.marketanalysiswithmeghmody.com/2022/03/nifty-metal-index-elliott-wave-anlysis.html As per Elliott Wave Analysis, prices are probably moving in wave iii or in wave iv which still opens wave v higher to complete wave c, once it is over prices will reverse back down. The level on the higher side can be 6750-6780 levels, but it will dip first somewhere close to 6330. The summation is Nifty Metal Index will dip close to 6330 levels and then will resume the major tren

GBPINR: Anticipated Happened

Image
 GBPINR 60 mins spot chart anticipated on 21st Feb 2022 GBPINR 60 mins spot chart happened on 14th March 2022 In my previous update dated 21st Feb 2022, I had mentioned, "  GBPINR is all set to plunge till 99.5-99 levels over short to medium term." The pair plunged till 99.58 at 10.30 IST, gaining 1.90% and it is looking weak going ahead - Anticipated Happened To view my previous article on GBPINR, click on the below link https://www.marketanalysiswithmeghmody.com/2022/02/gbpinr-third-correction-starts.html Prices have arrived near cluster of supports marked by arrow so one can partially book the pair at current juncture. Break of 99.5 can accelerate selling pressure going ahead but from here it seems downside is limited. As per wave theory, prices are on the brink to complete wave a of third correction and then it will start wave b higher which can move the pair back till 102 levels (spot).  The summation is GBPINR can test 99 levels but will reverse the direction to move ba

ACC: Neo Wave Diametric Pattern Anticipated Happened

Image
 ACC daily chart anticipated on 21st Feb 2022 ACC daily chart happened on 7th March 2022 In my previous update for ACC, I had mentioned that, "  ACC can move down till 1850 levels over short term, once the level of 2100 is broken decisively." Prices slumped after breaking 2100, opening well below it and made a low of 1900 which was close to my mentioned target of 1850, gaining 9.52% - Anticipated Happened To view my previous article on ACC dated 21st Feb, click on the below link https://www.marketanalysiswithmeghmody.com/2022/02/acc-neo-wave-diametric-pattern.html The current fall is an impulse and prices are now moving higher to form wave b or wave ii, so the short term bias is positive and will continue to monitor the movement as and when the wave unfolds.

Nifty: Elliott Wave Analysis Anticipated Happened

Image
 Nifty 60 mins anticipated on 7th Feb 2022 Nifty 60 mins chart happened on 24th Feb 2022 In my previous update on Nifty, I had mentioned that, "  Nifty is all set to plunge to test 16400-16000 levels over short to medium term." Nifty faltered as per my view and made a low of 16200 which was in the range mentioned by me - Anticipated Happened To check my previous article on Nifty, click on the below link https://www.marketanalysiswithmeghmody.com/2022/02/nifty-elliott-wave-analysis.html The benchmark has arrived near crucial support and can bounce back, this can eventually turn into complex correction and so wave x can move higher from here till the resistance of the falling channel or can start a fresh leg higher, crossing all the hindrances. The summation is Nifty is set to soar from here near till 17600-17800 levels over short to medium term.

USDINR: Anticipated Happened

Image
 USDINR 60 mins spot chart anticipated on 23 Feb 2022 USDINR 60 mins spot chart happened on 24 Feb 2022 In my previous article on USDINR, I had mentioned that, " The summation is USDINR is all set to soar till 75.7 over short to medium term." Prices made a high of 75.69 today thereby achieving my mentioned level - Anticipated Happened You can see my previous article on USDINR, for that just click on the below link https://www.marketanalysiswithmeghmody.com/2022/02/usdinr-elliott-wave-analysis.html I was expecting wave c higher despite of showing two probabilities, Now as wave c might have completed, chances are high that prices will change the trend by moving sideways and later continue the major trend.  I will continue to monitor this uptrend and will update as and when there is a major reversal. My targets in this currency pair is done.

Gail: Anticipated Happend

Image
 Gail 60 mins chart anticipated on 9th Feb 2022 Gail 60 mins chart happened on 13th Feb 2022 In my previous update I had mentioned that, " Gail is negatively poised an can falter near till 140-138 levels over short term." Prices plunged below 138 levels thereby achieving my mentioned level - Anticipated Happened The stock has completed wave b as expected in irregular flat pattern and it is all set to move higher in the form of wave c which can move till 152-155 levels over short to medium term. The summation is Gail looks positive over medium term to test 152-155 levels.

USDINR: Anticipated Happened

Image
 USDINR 60 mins spot chart anticipated on 24th Jan 2022 USDINR 60 mins sport chart happened on 15th Feb 2022 In my previous update of USDINR, I had mentioned, "  USDINR is firmly positive and can move near till 75.6-75.7 levels once the level of 74.7 is decisively crossed and sustained." Prices achieved the above mentioned level of 75.7 (spot) on 15th Feb 2022 and reversed from there - Anticipated Happened. To read my previous article on USDINR: Inverse Head and Shoulder Pattern click on the below link https://www.marketanalysiswithmeghmody.com/2022/01/usdinr-inverse-head-and-shoulder.html Currently prices are moving in complex correction which is (a-b-c-x-a-b-c) this can be wxy eventually or can be simple a-b-c and the current fall is wave x. In both the scenarios, prices will continue to surge and possibility is high it can transcend its ATH.

GBPINR: Anticipated Happened

Image
 GBPINR 60 mins chart anticipated on 20th January 2022 GBPINR 60 mins chart happened on 11th February 2022 In my previous update for GBPINR, I had mentioned that, " GBPINR is mildly positive and can find resistance at 102-102.5 levels over short term." The pair moved as per the prognostics and reached the mentioned level of 102.5 on 11th February 2022 - Anticipated Happened. To read my previous article on GBPINR dated 20th January, you can click on the below mentioned link  https://www.marketanalysiswithmeghmody.com/2022/01/gbpinr-triple-correction.html GBPINR was trading in a corrective fashion after bouncing form the lower end of the falling channel. Prices were likely to move either in three waves or complex waves towards it resistance.

EURINR: Anticipated Happened

Image
 EURINR 60 mins chart anticipated on 2nd Feb 2022 EURINR 60 min chart happened on 10th Feb 2022 As mentioned in my previous update about EURINR, the pair moved in similar fashion as expected. I had mentioned on 2nd Feb about this pair, " EURINR is all set to move higher till 86.4-86.6 over short to medium term with support at 83.2." The pair made a high of 86.3 on 10th Feb 2022 and is now showing signs of reversal. It is still early to come to a conclusion that the pair has reversed - Anticipated happened. To read my previous article on EURINR: Elliott Wave Analysis you can click on the below mentioned link https://www.marketanalysiswithmeghmody.com/2022/02/eurinr-elliott-wave-analysis.html Prices after forming wave a and wave b in a regular flat pattern, it was expected that wave c will come close to wave a end , this has exactly happened in the above chart and I was successful in capturing the trend.

MCX Metaldex: Anticipated Happened

Image
 MCX Metaldex 60 mins anticipated on 2nd Feb 2022 MCX Metaldex 60 mins happened on 9th Feb 2022 In my previous update I had mentioned that, " MCX Metaldex is positively poised and can surge till 18600-18700 levels as far as 17850 is protected." Prices made a high of 18900 levels in the opening session today, thereby achieving my above mentioned level- Anticipated Happened. Here is the link of my previous article https://www.marketanalysiswithmeghmody.com/2022/02/mcx-metaldex-elliott-wave-analysis.html The index is moving in wave ((v)) of wave (iii) which is likely to be extended and can soar further. I am monitoring the price movement and will update timely.

DLF: Anticipated Happened

Image
 DLF 60 mins chart anticipated on 24th January 2022 DLF 60 mins chart happened on 27th January 2022 In my previous update on DLF I had mentioned that, "  DLF is negatively poised and can falter towards 360-350 levels over short term." Prices faltered towards 362-363 levels, close to my level - Anticipated Happened. I was expecting an impulse fall and so has anticipated wave iii followed by wave iv and then wave v lower, the stock plunged as per the prognostics and reversed from crucial support mentioned above.

MCX Crude Oil Anticipated Happened

Image
 MCX Crude Oil daily chart anticipated on 28th December 2021 MCX Crude Oil daily chart happened on 19th January 2022 In my previous article on MCX Crude I had mentioned that, "  MCX Crude is positively poised and can move higher near to 6100 followed by 6400 over medium term." Within twenty trading sessions MCX Crude has achieved my above mentioned level- Anticipated Happened To read the previous articles on MCX Crude click on the below links MCX Crude Anticipated Happened and Elliott Wave Analysis https://www.marketanalysiswithmeghmody.com/2021/12/mcx-crude-oil-anticipated-happened-and.html MCX Crude Oil Elliott Wave Analysis https://www.marketanalysiswithmeghmody.com/2021/12/mcx-crude-oil-elliott-wave-analysis.html It will be important to see  how this wave will unfold, I will monitor the movement and keep you all posted.

MCX Crude Oil Anticipated Happened and Elliott Wave Analysis

Image
 MCX Crude Oil daily continuous contract Anticipated on 7th December 2021 MCX Crude Oil daily continuous contract Happened on 27th December 2021 From the above chart, MCX Crude Oil which was trading at below 5500 in the first week of December 2021, I had mentioned that, "  MCX Crude Oil is all set to test the level of 5700-5800 over short to medium term as far as 5000 levels are protected on the lower side." - Anticipated Happened. Crude Oil touched 5700 on 27th December 2021 thereby achieving my first target. To read the previous article on MCX Crude Oil, you can click on the link here https://www.marketanalysiswithmeghmody.com/2021/12/mcx-crude-oil-elliott-wave-analysis.html As per Elliott Wave theory, I have counted the recent rally as wave b which can be a flat, the minimum criteria of flat is at 6100 which will eventually turn into normal flat pattern followed by irregular. My next target after it surpasses 5800 will be 6100 followed by 6400. The summation is MCX Crude i

Tesla: Elliott Wave Analysis and Anticipated happened

Image
 Tesla daily chart anticipated on 16th July 2021 Tesla daily chart happened on 25th October 2021 From the above chart, prices moved precisely as per my prognostics. I had mentioned for Tesla on 16th July 2021 , " Tesla stock is positively poised and can move higher near till $900 over even cross it over medium term." The stock reached not only $900 but also crossed over medium term as it is currently quoting at $1200 levels odd. To read my previous article on Tesla you can click in the link mentioned below https://www.marketanalysiswithmeghmody.com/2021/07/tesla-elliott-wave-analysis.html At present prices are moving in wave iii which is likely extended and so prices will continue to move higher as wave v is pending on the higher side. Wave iv can correct which can be utilized as a buying opportunity. The summation is Tesla can be bought around $1000-$1100 levels for the level of  $1300-$1450 levels