Posts

Showing posts from August, 2019

Nifty Weekly Analysis on 3rd Sep 2019 Video

Nifty analysis, chart patterns, trend lines, higher highs and higher lows, Technical pattern calculation, trend reversal if any All in one Click on the link https://youtu.be/K5rr0MaL08Q

Nifty Weekly Analysis on 3rd September 2019

Image
Nifty Daily Chart From the above chart, Nifty has given a bullish break in a falling blue channel, giving a positive indication. After giving a positive break, last week it sustained and closed above the channel. At present it is facing resistance of 11045, which once crossed can see further buying taking index much higher. My wave counts from current fall to recent high is shown in the above chart. I have shown two wave counts  1. a-b-c  2 a-b-c-x-a-b-c Both of the above counts suggests that one higher degree fall is over and a breather or a reversal is due which Nifty has already given. It is difficult to come to a conclusion that last week move is a reversal or a relief rally. The recent up move is so marked as (a-b-c) as of now. In this pattern wave b has retraced 61.8% of wave a and will open wave c higher which can take price till 11180-11200 which is 61.8% of wave a to wave b (Projection). So if everything is correct Nifty will move higher to achieve the le

Nifty Anticipated Happened and forecast

Image
Nifty hourly chart In my previous update dated 19th August 2019, I had mentioned that, “Nifty will continue to face resistance of 11180-11200.As far as this level is intact, the index is set to dip near till 10700-10650 levels, once 10900 is broken decisively.” – Anticipated Happened.  The index on Friday opened with a gap down and made a low of 10637 thus achieving my level of 10700-10650 levels. After making the intraday low prices shot up and closed above 10800 levels. In the above hourly chart, prices have shown signs of a bounce back but I will not say that a reversal has happened this is because there is no price confirmation. Prices are still trading in a falling black channel as seen in the daily chart. As far as prices persist in this channel the bias is still negative. Over short term it can bounce near till resistance of the channel which is placed at 10900-10930 levels. Any move above this level will give a bullish break in a falling channel pattern.  Wave th

Nifty Bank: Five waves down

Image
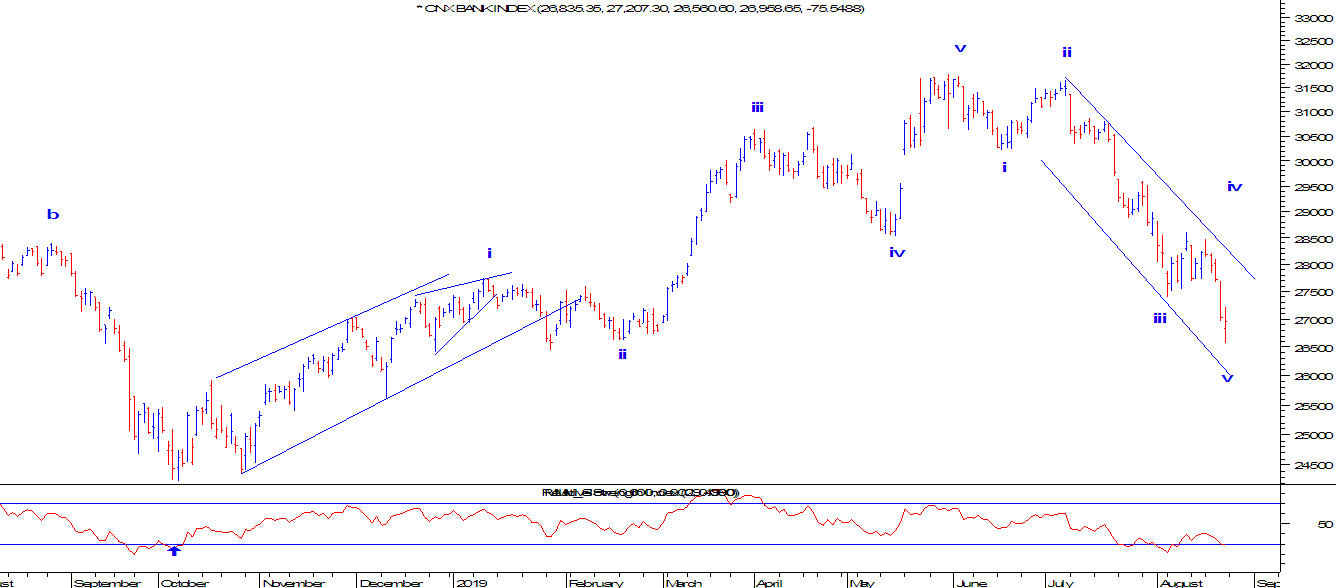
Nifty Bank Daily chart In the above daily chart, Nifty Bank is near support of the falling channel. There are chances for the index to move higher as RSI is exhibiting positive divergence. Also if you observe prices had found support near the horizontal line which was providing support to this index earlier as well. As far as 26500 is protected on the downside, it is likely that the index will move in a positive direction which can test the previous highs placed close to 28000 levels. As per wave theory, prices have completed five waves down, this is an indication that a reversal is due which can soar price at least 61.8% of the previous fall which comes to 29800 levels. This scenario is only possible if prices are moving in a zigzag pattern (3-3-5). The second scenario is, if prices are moving down in an impulse then 38.2% is where wave ii will be completed which is placed at 28500. The summation is, prices are likely to give a bounce which can surge price till 28000

How to identify Impulse wave of Elliott Wave

I have explained the golden rules and few other techniques of how to identify Impulse wave of Elliott wave. You all can check the short version in the below video. Click here https://youtu.be/BUDtbASFVJ4

Nifty Weekly Analysis on 19th August

Image
 Nifty hourly chart In the above hourly chart, the index moved more in a sideways pattern with no directional move within range of 200-250 points. The support of 10900 and on the upside it faced resistance at 11180-11200 levels. For a directional move to emerge it is important that prices should move above 11200 or break below 10900 decisively.  Wave theory suggests that, prices are moving in a Neutral Triangle pattern which is a Neo Wave pattern. The pattern has five internal legs (a-b-c-d-e) but here wave c will be the longest amongst wave a and wave e. The pattern looks to be completed and prices are set to falter. Any move below 10900 will open further negative possibilities which can drag prices till 10700-10650 levels. The resistance will be at 11180 levels.  The summation of the above three charts is, Nifty will continue to face resistance of 1180-11200.As far as this level is intact, the index is set to dip near till 10700-10650 levels, once 10900 is broken dec

MCX Copper: Channel Breakdown

Image
MCX Copper 60 mins chart Dr. Copper was moving precisely in a rising channel but the positive momentum was halted once this channel was broken. This is an indication of reversal in price action. The metal is also trading below both it's short term averages on hourly basis indicating negative trend to emerge. The summation is with break of channel and it's previous low, prices are more likely to sink.

Nifty Weekly Time Cyle

Image
In the Weekly chart of Nifty, the index continues to consolidate near the support of the rising trend line. From past three weeks it made an attempt to break this trend line but managed to close above it. This is an indication that the bears and bulls are still not clear about the further direction for the index. I have shown 8 weeks  Time cycle in the above chart which has worked very well to capture the reversal. After 8 weeks of completion markets have reversed the direction shown by Arrows up and down. At this juncture the 8 week cycle is over and market is ready for next move on either side where I have marked (x?).  It is imperative for prices to break 10900-10850 levels decisively to change the bull trend into bear. Break of this trend line which is providing massive support to the index will accelerate selling pressure dragging prices lower.  

Nifty :Symmetrical Triangle pattern on smaller time frame

Image
Nifty 15 mins chart The index which was moving in a falling red channel has given a bullish break this opening positive possibilities. After bullish break the index moved in a stiff range. Despite of movies ng in a narrow range prices protected the level of 10900 and as a result index gave close above 11000. From wave perspective, the index is moving Symmetrical triangle pattern. Earlier I thought it is in Neutral Triangle. Now the former one is much likely and if prices hold 10900 then there can be a good reversal coming ahead.

The power of Ending Diagonals

Image
Daily chart of Crompton Greeves and Havells  Ending Diagonal (ED) or Wedge pattern are normally a reversal patterns. ED occurs are Wave i, wave c wave v etc. It is important to see how dynamic prices react  post the completion of the pattern.  In the above two charts of Havells and Cropmton Greeves I have made an attempt to show you the importance of the ED pattern and how prices react post pattern. The above two charts self explanatory.

Zinc: Anticipated Happened and Forecast

Image
MCX Zinc Daily chart In my previous update of Zinc I had mentioned that ," A  relief rally is expected in MCX Zinc which can take prices higher till 185-187 levels in near term." Read the full article here https://www.marketanalysiswithmeghmody.com/2019/08/mcx-zinc-corrective-pattern-to-unfold.html As per Wave forecast, prices have completed wave iv of wave iii in extension and will start wave v down till 178 levels. Once wave iii is completed wave iv at higher degree will start pushing prices higher till 186-188 levels and then wave v down near till 175-172 levels which will complete wave c. The summation is prices will move down with resistance at 189 and the support will be at 175-172 levels. A whipsaw action is likely.

MCX Nickel: Impulse Cycle and Forecast

Image
MCX Nickel Daily Chart MCX Nickel is one of the out performers amongst base metals. The metal is moving in a higher highs and higher lows. Currently it is hovering near crucial resistance and can relieve back down but will not change the major trend. Elliott Wave theory suggests, prices are moving in a third wave impulse and can complete soon. Once it is completed prices will move back down in wave iv close to 1050 levels. The termination of wave iv will again push prices higher near till 1200 levels.  The summation is Nickel will continue to out perform and can test the level of 1200 after dip in price close to 1050.

MCX Crude: Dynamic move awaits

Image
MCX Crude Daily Chart MCX Crude is protecting the level of 3500 as it was tested twice in past 2 months. Also 61.8% of the previous upmove (2993-4692) falls at around 3500-3600 levels. I think this will act a crucial support for black gold in coming weeks.  Wave theory suggests, prices are moving in a zigzag pattern (A-B-C) where wave b was completed in complex correction (w-x-y) and managed to end close to 61.8% of wave A. So if it is Zigzag pattern wave b should not go below 61.8% which in this case it is fulfilled. So after completing wave B wave  C will start which can take prices higher than the end of wave A. The summation of the above chart is, Crude is set for a dynamic move which can take prices higher above 4692. I think the range of 4700-5000 is where Crude will move in coming weeks.

Nifty: In making of Neutral triangle (Neo Wave)

Image
Nifty Hourly chart Nifty from past two days has actually moved in the range of 11200-10900 levels, either 200 points up or down. This sideways movement is an indication that market is digesting the recent fall. Once it is done, prices will resume the major trend. In my earlier update I had mentioned that prices are moving in a falling channel. Today, the index faced the resistance of the channel close to 11065-11080 levels but could not cross it as a result it faltered from there. I have not shown the channel here but to read the earlier article you can see 'Nifty Weekly Analysis on 13th August. From wave perspective, Nifty made a neutral triangle pattern. Neutral triangle is a pattern which comes in Neo wave theory. The pattern has five internal legs (a-b-c-d-e) but here wave c will be the longest amongst wave a and wave e. Here wave e has ended today so after Independence day holiday, Nifty will start moving down in a new leg.

Nifty Weekly Analysis on 13th August

Image
Nifty hourly chart In the above hourly chart, prices are facing falling channel resistance, any move below 11100 will infuse selling pressure which can drag prices lower. It is likely that prices will fill the gap which was made on Friday. If the gap is filled then it will be an exhaustion gap indicating the uptrend is over.  From wave perspective, after completing wave c down near 10780 levels, the index rose 400 point in a three wave structure (a-b-c) to possibly complete counter trend. From here prices will dip near till 11050-10950 range. Once this is done next week it will be important to see if prices show signs of reversal. The summation of the above  chart is, Nifty is likely to face resistance of 11200 . Prices will dip further once the level of 11100 is taken out which can accelerate selling pressure dragging it lower till 11050-10950 range in coming short end week.

IDFC First Bank: Third wave impulse to start and Fibonacci Projections

Image
IDFC First Bank From above daily chart of IDFC First Bank, prices are moving in a higher highs and higher lows formation. The first hurdle will be around 46 levels, break of this level will infuse further buying pressure taking prices way higher. (marked with horizontal line). As per wave theory, prices are moving in an impulse fashion. It completed wave ii at 36 levels and has started wave iii. This wave iii is likely to end in-between 60-66 levels, which can be an equality or more than 100% of Fibonacci projection. The summation of the above chart is IDFC First is all set to have a dynamic move which can settle at 60-66 levels over medium term.

MCX Zinc: Corrective pattern to unfold- Happened

Image
MCX Zinc Daily chart Anticipated on 7th July 2019 MCX Zinc Happened on 8th August 2019 In my previous update on MCX Zinc I had mentioned that, " Zinc is moving precisely in a falling blue channel. Prices recently faced the resistance of the channel and reversed. It is also on the brink to break its previous low (marked by blue horizontal line). Any break below 194 will open further negative possibilities which can drag prices way lower, near o the support of the channel. Full article here https://www.marketanalysiswithmeghmody.com/2019/07/mcx-zinc-corrective-pattern-to-unfold.html From wave perspective, prices are currently moving in wave c which seems to be elongated. This means that the subdivision of the waves within wave iii are equivalent to one higher degree. Currently prices are in wave iii in which it has completed wave iii. A pull back can take prices higher till 185-187 levels in the form of wave iv of wave iii. In short, a relief rally is expected

Berger Paints: Classic Symmetrical Traingle with Bollinger Bands

Image
Berger Paints Anticipated on 5th August 2019 In the daily chart, prices are moving up by closing above its previous day high especially after making a low near 300 levels. Currently it is consolidating above the falling trend line which is a positive sign. The stock was moving in a symmetrical triangle pattern in which price has given a bullish break along with it Bollinger bands is been used which has also started expanding giving an indication that prices are now headed for the next up move. From wave perspective, the stock have completed wave b at 300 levels in a form of symmetrical triangle and is now moving higher in wave c which is impulsive in nature. Currently prices are consolidating within 330-340 levels. The summation is, the stock is positively poised and can move higher till ... levels as far as ... is protected down on.....

Nifty Weekly Analysis on 5th August 2019

Image
Nifty 60 mins chart In the above hourly chart, prices showed resilience from the support of the channel (shaded). It is likely that a short term bounce is on the cards which can surge prices higher near till 11050-11080 levels. RSI and prices are showing positive divergence, this indicates that the negative momentum can halt for a counter rally. From wave perspective, prices have completed wave c. After completing wave c next leg will start anytime soon. There are high chances that the channel resistance can also be taken out. The summation  is there is a high possibility that a gap down opening can be seen on Monday but as far as 10850 is intact on the downside, prices are expected to move in a positive direction near till 11050-11080 levels in coming week.  I have published this excerpt from "The Nifty Waves Weekly Forecast" which is a weekly update giving in-dept view of weekly, daily and 60 mins chart. The report is published on Monday before market opens. Subs