Berger Paints: Classic Symmetrical Traingle with Bollinger Bands
Berger Paints Anticipated on 5th August 2019
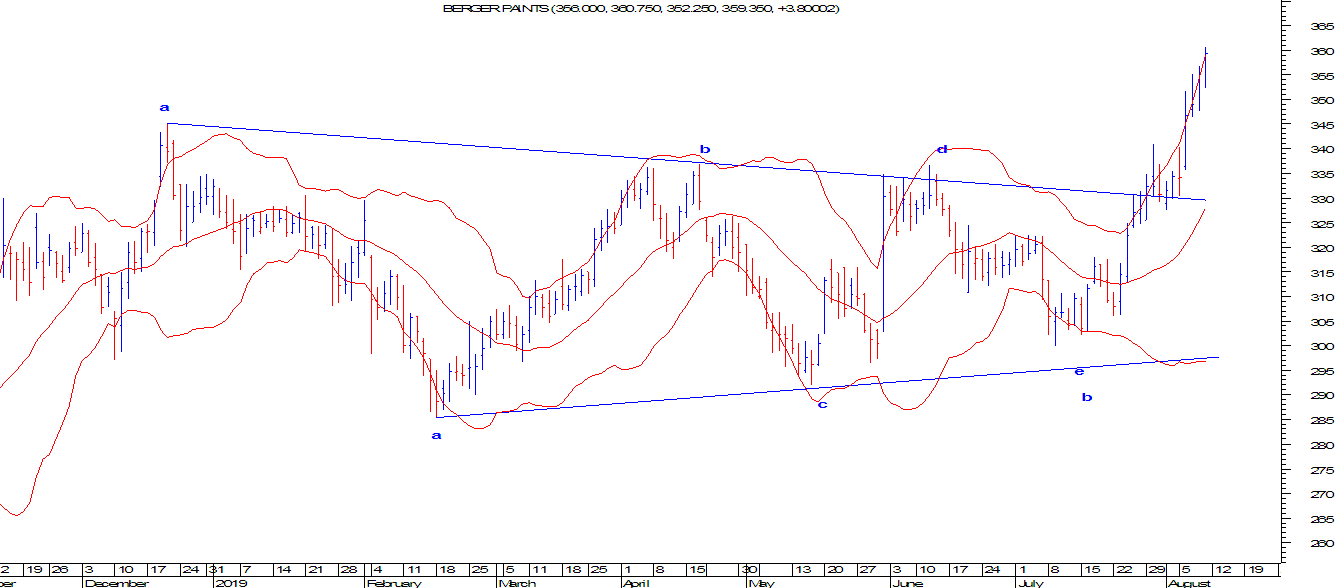
In the daily chart, prices are moving up by
closing above its previous day high especially after making a low near 300
levels. Currently it is consolidating above the falling trend line which is a
positive sign.
The stock was moving in a symmetrical triangle
pattern in which price has given a bullish break along with it Bollinger bands
is been used which has also started expanding giving an indication that prices
are now headed for the next up move.
From wave perspective, the stock have completed
wave b at 300 levels in a form of symmetrical triangle and is now moving higher
in wave c which is impulsive in nature. Currently prices are consolidating
within 330-340 levels.
The summation is, the stock
is positively poised and can move higher till ... levels as far as ... is
protected down on.....


Comments