Posts

Showing posts from October, 2020

Tata Motors Elliott Wave Analysis

Image
 Tata Motors daily chart Tata Motors hourly chart In the above daily chart, prices are moving in a rising channel which indicates that the trend is firmly positive. The stock has bounced from the support of the channel and it is very much likely it will face resistance near its previous high. RSI is going up from over sold territory. In the hourly chart, the auto stock was moving in a lower highs and lower lows after making a high of 155. However, recently it failed to move below its previous low (below black horizontal line). This indicates that the short term trend which was negative is on the brink to change. RSI has reached overbought and can relieve from current levels. From Waves perspective, after completing one correction (a-b-c), currently prices have completed wave a in a three wave structure and it is now moving in wave b which is also a three wave structure. Here in wave b wave c can move near to the start of wave a placed at 146 levels. If it is converted into regular

Nifty Elliott Wave Analysis

Image
 Nifty daily chart Nifty hourly chart In the daily chart, the index continues to impress as it is moving precisely in rising channel and also in a higher highs and higher lows. Last week prices opened on a positive note but nearing to the end it closed near to the high of the week. After relieving from the overbought zone, daily RSI is moving again towards 70 terrain. As shown in hourly chart, prices are consolidating near its previous highs, it is imperative for the index to cross it decisively for acceleration of buying pressure. Here, I would also like to add that the target of Nifty which I had mentioned last week is still intact which can come to 12100-12130 levels. RSI is rising from the bottom and has the vacuum to move towards overbought region. As per Wave theory, the index is moving in wave c, in which wave v is ongoing. However, there is a possibility that wave v is forming ending diagonal as impulsive is ruled out. Last week it formed wave i and wave ii of ending diagon

Nifty Elliott Wave Analysis

Image
 Nifty daily chart Nifty hourly chart In the daily chart, Nifty is moving in a higher highs and higher lows and it is precisely moving in a rising channel formation. When prices are moving in a rising channel, it is very clear that prices are in an uptrend, unless and until there is a discontinuation of rising formation. Also prices are showing resilience from the horizontal black line which was earlier as a resistance now acting as a support. Daily RSI which tested the overbought territory has relieved from it. As shown in hourly chart, the index last week corrected from the highs and made a low of 11658 from there on the last day of the week it managed to close above 11750, 100 points above the low of the week. Here, prices crossed its previous highs which is a positive sign and continues to be in a positive trend as far as the level of 11658 is not broken decisively. As per Wave theory, the index is moving in wave c which is impulsive in nature. As of now it has completed wave i

Tata Steel Anticipated Happened

Image
 Tata steel hourly chart anticipated on 10th October 2020 Tata steel hourly chart happened on 16th October 2020 In my previous update on Tata Steel I had mentioned that, " TATA Steel can move up near to 390-400 price range in near term with support at 361 (closing basis)." To read the previous article of Tata Steel, click on the link https://www.marketanalysiswithmeghmody.com/2020/10/tata-steel-elliott-wave-analysis.html Prices on 16th October 2020 made a high of 394 and before that it made a low of 363 which was close to my support level. After marking the low of 363 it went up and made a high of 394 on the last day of the week. - Anticipated Happened. Elliott wave in theory and in practice is too difficult but you all can learn in my one month webinar, both theory and how to plot waves on charts. the details are given below, next batch starts from November. Education Learn Technical Analysis in our 4 month course to help you to identify better trade setups. This course will

DLF Elliott Wave Analysis

Image
 DLF daily chart DLF hourly chart In the above daily chart, prices are moving in a rising channel, recently there was resilience which made the stock move towards its preceding high and at present it is hovering near to 166 levels. It is imperative for prices to move above this level for opening up further upside which will accelerate buying pressure. Daily RSI is above the center line which is a positive sign. In the hourly chart, the stock which was moving in a falling black channel has finally given a bullish break. Prices tested the support level of the trend line which was earlier acting as a support level (also known as throwback). It looks now that prices will continue to move higher and test its previous high placed at 180 levels. From Waves perspective, after completing wave a at one higher degree around 180, prices corrected in a three wave structure and completed wave b at 142 levels followed by wave c in which wave i and wave ii is over and wave iii has already started,

MCX Crude Oil Elliott Wave Analysis

Image
 MCX Crude Oil hourly continuous chart In hourly chart, the energy commodity is moving in a sideways pattern in a range of 3050 to 2750 levels, as far as price persists in this range no trending move is expected. Within this range, there is another range marked by two horizontal lines, it is important for prices to break this range which can open trending move. RSI is above 50 which is a positive sign. As per Wave theory, prices wave a at around 3050 followed by wave b which has gone till 2750 and wave c in which wave i and wave ii is completed, where wave ii is in flat pattern and wave iii has started higher which can go till 3150, 100 of wave i (minimum extension). The summation is MCX Crude Oil can move up till 3150 with support placed at 2880 levels, the bias is strongly positive. Education Learn Technical Analysis in our 4 month course to help you to identify better trade setups. This course will be conducted every twice in a week for around 2 hours. This theory can be appli

Tata Steel Elliott Wave Analysis

Image
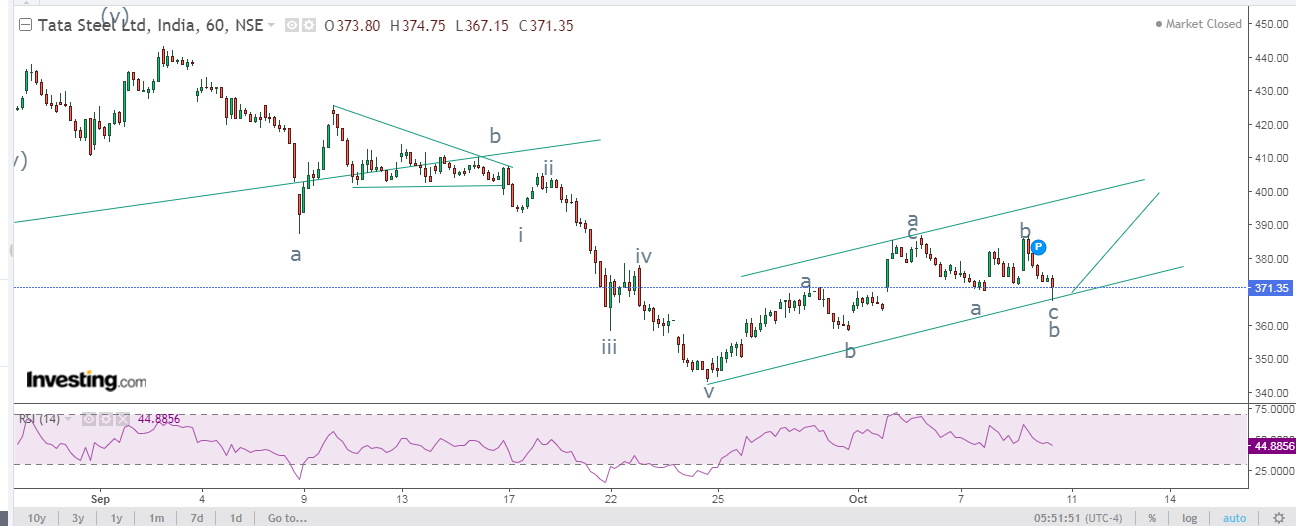
 Tata Steel daily chart Tata Steel hourly chart From daily chart of T Steel, prices which were moving in a lower highs and lower lows has discontinued the formation as prices are above the falling black line. Price confirmation can only be obtained once it crosses above 420 levels. There can be some upside from current levels which can push prices near to that zone. In hourly chart, the stock is moving in a rising channel formation and can move up as it is near to the support of the channel. The resistance for the stock comes to 400 as RSI has also relieved from over bought zone. As per Wave theory, prices either have completed wave iv or it is still ongoing. If it has completed than wave v has to be a diagonal, if not then wave iv is ongoing in which double correction is about to unfold as wave x is still forming. The summation is TATA Steel can move up near to 390-400 price range in near term with support at 361 (closing basis).   Education Learn Technical Analysis in our 4 mon

ONGC Elliott Wave Analysis

Image
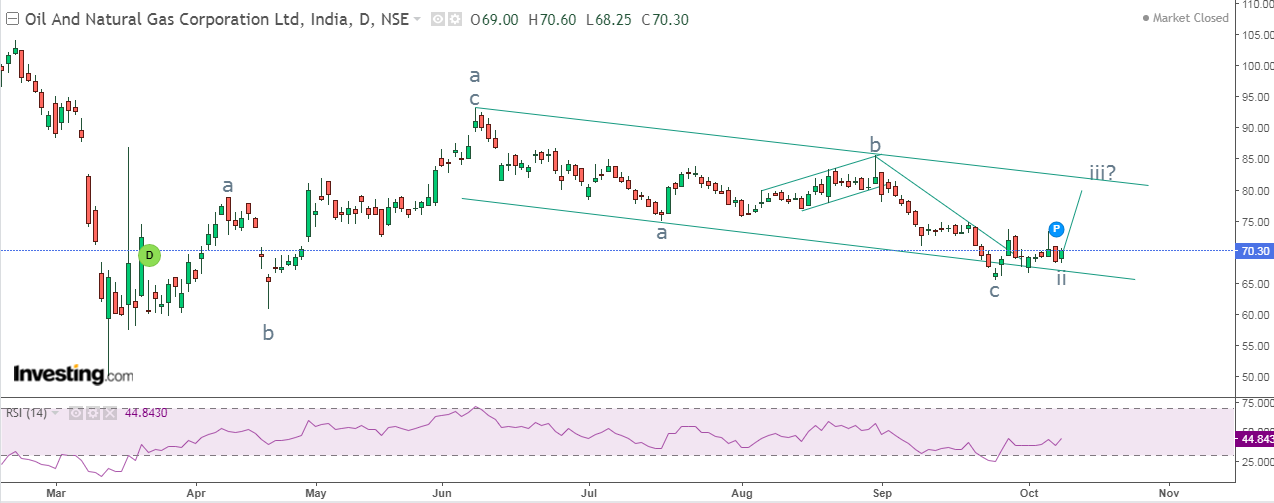
 ONGC daily chart ONGC hourly chart In the above daily chart, prices are moving in a falling channel, where it is near the support of the channel and opens the possibility to bounce from current levels. However, as far as there is no discontinuation of lower highs and lower lows, prices will continue to be in a negative trend. Daily RSI is out from oversold region. In the hourly chart, there is a bullish trend line break which is a positive sign for prices to show some strength. At present it is above this falling trend line and can move up from here to its immediate resistance of a small channel which is drawn coming near to 76 levels. RSI has relieved from overbought terrain and can move up from here. From Waves perspective, after completing wave c in an impulse fashion, prices completed wave i and wave ii of bigger wave c and is now open to wave iii which can go till 100-161.8% of wave i to wave ii which comes to 76 followed by 81. The summation is, the bias continues to be po

Nifty Bank Elliott Wave Analysis

Image
 Nifty Bank Daily chart Nifty Bank hourly chart In the daily chart, Nifty Bank is moving in a sideways direction with support at 21000 and resistance at 25300 levels. It is seen from the chart, that prices have shown resilience from 21000 and it is moving near to its resistance. It is likely that the index will test 25100-25300 levels over short term. RSI is also inching towards overbought zone. As shown in hourly chart, the index is moving in a rising channel and it is moving in a higher highs and higher lows. Any dip here can be utilized as a buying opportunity as it can test its previous high. As far as prices persist in this rising channel the bias will be firmly positive. As per Wave theory, it is very clear that prices are moving in wave c in an impulse fashion. Wave a was a complex structure and wave b was a zigzag, so now wave c is going up which can move till end of wave a. The summation is Nifty Bank is all set to move till 25100-25300 price range in near term with supp