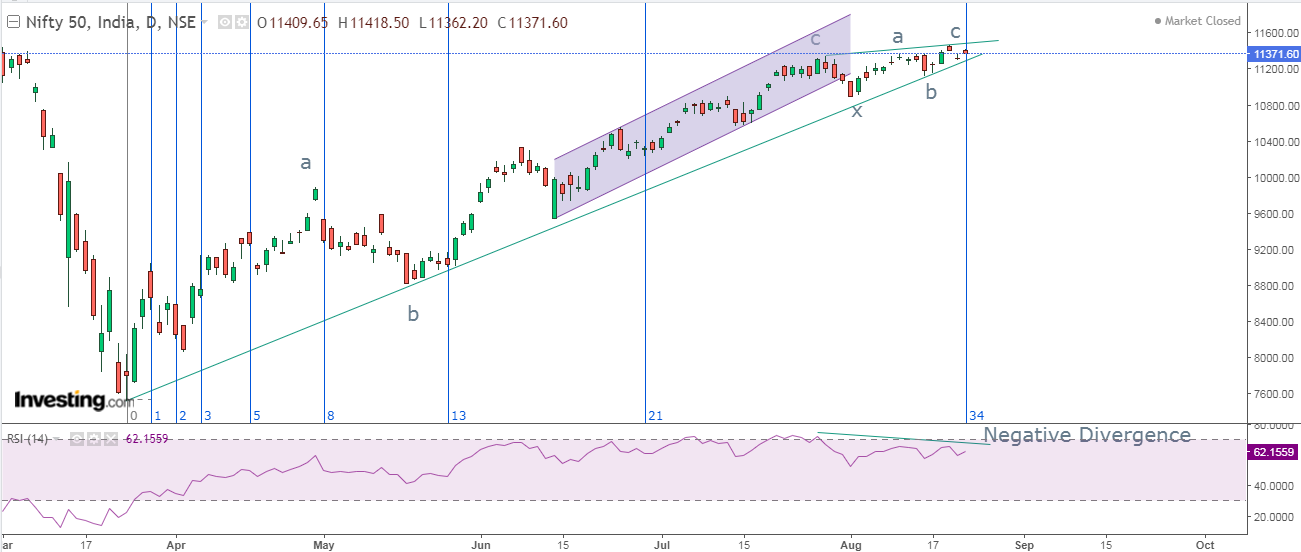
Nifty Elliott Wave Analysis
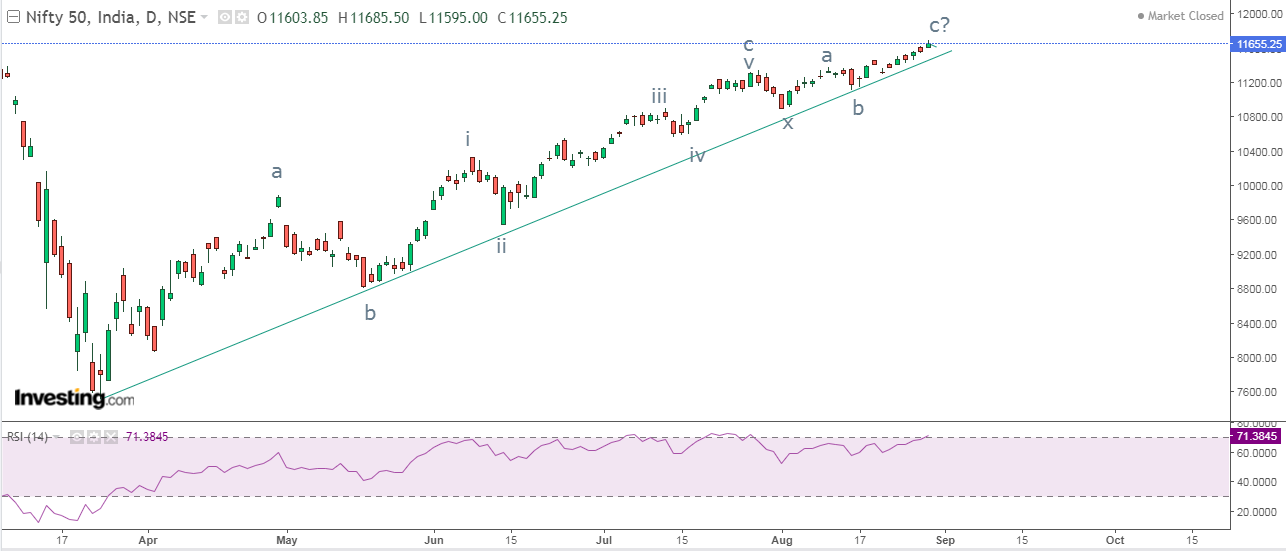
Nifty daily chart Nifty hourly chart In my previous update, I was sure that 11520 will be the resistance but it surpassed thus negating my view of 11200 a lower level. In the daily chart, the index continues to move in stealth uptrend by crossing its previous day high and making a new one. Last week market made a new high of 11693 and closed near the high of the week at 11655. As of now prices continue to trade above rising trend line and there is no discontinuation of higher highs and higher lows which makes this index firmly positive. However, RSI continues to give whipsaws near the overbought zone. As shown in hourly chart, last week there was no correction in the index and as such there is a high possibility for a correction to come, this correction can be sideways to negative but it is unlikely to breach 11450 levels. RSI is near 70 from where overbought zone starts. As per Wave theory, after completing wave b at 11114 prices have started wave c in which it has complet...