Posts

Showing posts from November, 2022

GBPINR Elliott Wave Analysis

Image
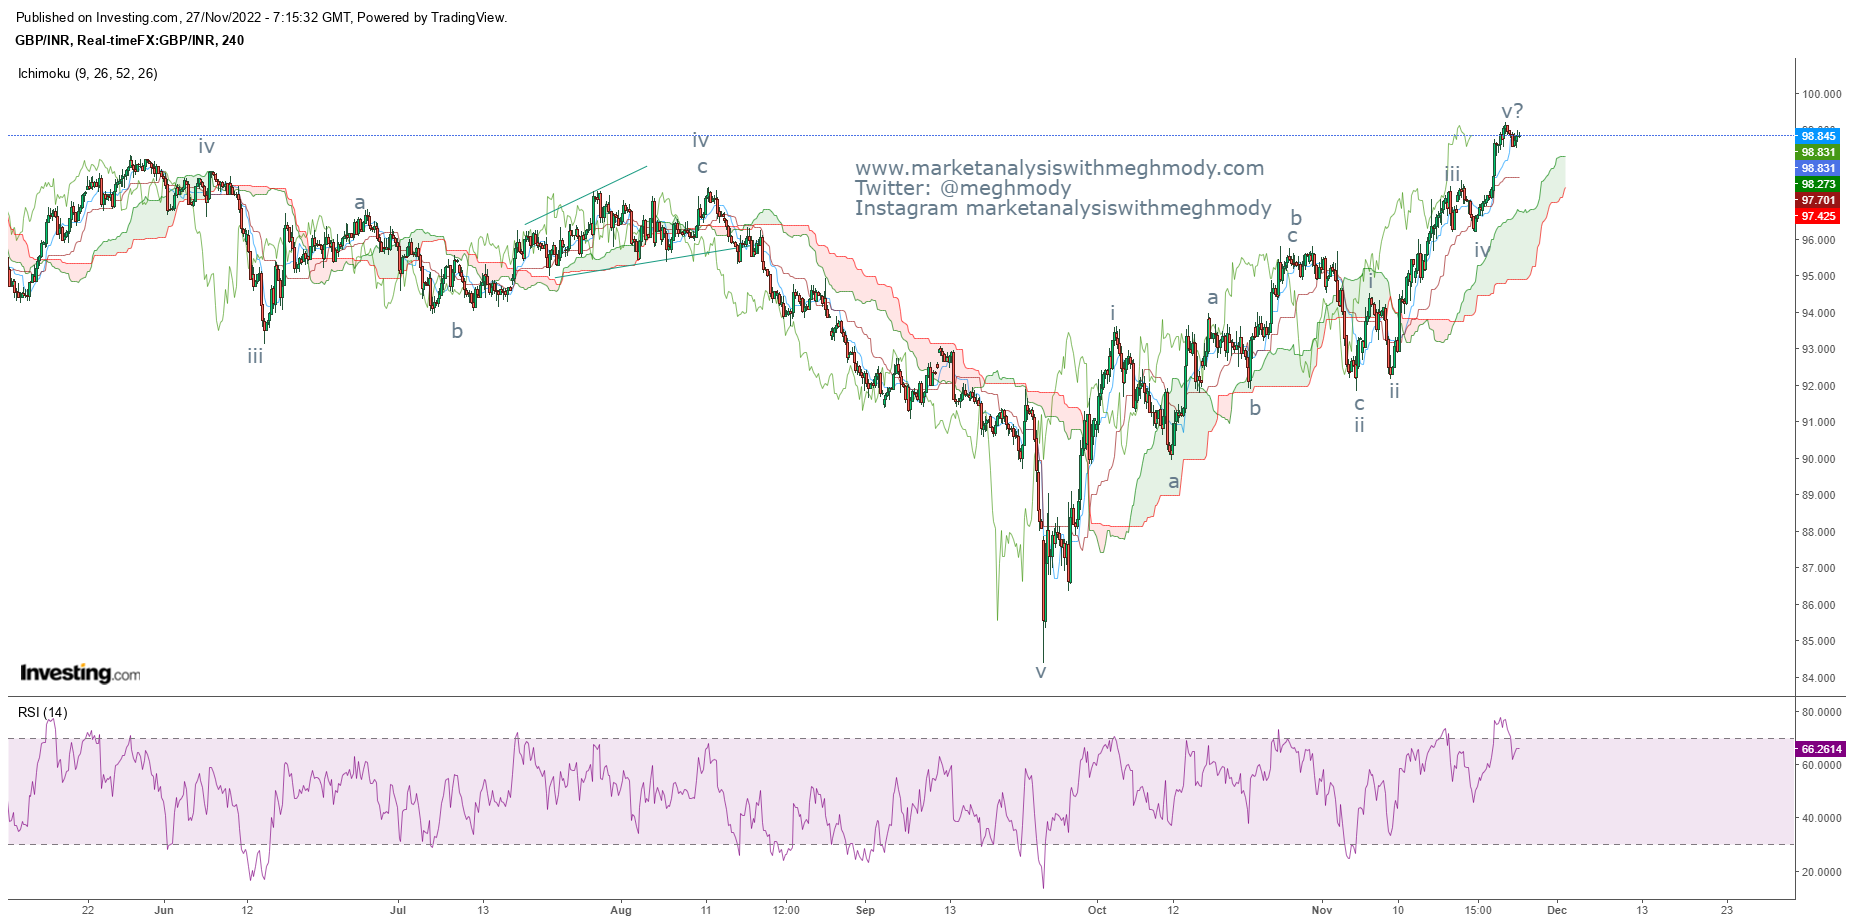
 GBPINR 4 hour spot chart Analysis As seen in the above chart, Cable continues to move in a positive direction and has picked up momentum much ahead of the political turmoil in UK. At present the pair has the tendency to move in a counter trend which will be more likely to be sideways to negative as RSI is also relieving from the overbought terrain. The Ichimoku cloud is poised at 98.3 levels where the pair can find support for the short term. As per wave theory, prices might have completed wave iii in five wave structure and now can retrace back for the iv wave to form. The support is at 98.30-38.25 levels which might complete wave iv followed by wave v. Any move back to 98.50-98.30 can be utilized as a buying opportunity. The summation is GBPINR can dip towards 98.50-98.3 range which is a buying opportunity as it can move till 99.50-99.8 levels over short to medium term.

MCX Gold Elliott Wave Analysis

Image
 MCX Gold hourly continuous chart Analysis From the above chart, MCX Gold has moved above the falling channel thus giving bullish break. The yellow metal has also started forming higher highs and higher lows thus discontinuing the negative formation. In the lower panel, MFI has started picking up from the oversold zone which will support the prices go gold going ahead. As per wave theory, gold is moving in wave c where it is on the brink to complete wave iv and open wave v which can push prices near till 53000-53200 levels. The summation is MCX Gold can soar till 53000-53200 levels over short term with support placed at 52030 (closing basis).

US 10 Year Yields and Elliott Wave Analysis

Image
 US 10 Year Yield daily chart Analysis As shown in the above chart, US 10 year yield is moving in a higher highs and higher lows and it is precisely moving in a rising channel. Recently it faced the resistance of the channel and reversed, currently moving in a negative direction. It has also breached its previous low of 3.68%, thus opening further negative possibilities. A weak 10 year benchmark yield supports riskier assets indicating good inflows in global equities. The global equities has started picking up momentum in the last three weeks on the back of weak yields. ADX is also indicating that the strength of the upward trend has subsided. From Waves perspective, Wave v has ended at 61.8% from wave 0 to iii added to iv thus giving an indicating that the top has been in place. Prices are now moving in opposite direction and has opened wave a on the downside which can move down towards 3.55% The summation is US 10 Year Yield is negatively poised and can move down towards it

Nifty Elliott Wave Analysis

Image
 Nifty daily chart Nifty 2 hour chart Analysis From daily chart, the level of 18200 will act as a crucial support for the index, only a breach of this level will infuse selling pressure. Nifty is positively poised and can reach near till 18600 levels which I am saying from past three weeks now. The momentum has become slow which is a cause of concern as of now. ADX has started picking up strength which is a positive sign. In 2 hour chart, prices are moving in a 45 degree angle which opens the possibility of a rising wedge pattern. This pattern I was expecting last week also indicating that distribution has started and can move slowly move near to the all-time high of 18600 levels. RSI has started exhibiting negative divergence. As per Wave theory, Wave C is still ongoing and has opened wave v of wave c which looks to be in an ending diagonal. The summation is Nifty continues to move in a positive direction with support at 18200 and on the upside 18550-18600 will be the resistance

Nasdaq and Elliott Wave Analysis

Image
 Nasdaq daily chart Analysis As shown in the above chart, Nasdaq continues to slump in a lower highs and lower lows fashion. However, prices have shown resilience and has started moving higher which can move towards its immediate resistance which is the falling trend line. Daily RSI has vacuum to move higher to enter back in the overbought terrain. Currently it is above the center line which is positive sign. From Waves perspective, the index has completed wave a and has opened wave b after forming wave x higher, this clearly means that the benchmark is moving in a double correction (a-b-c-x-a-b-c). Currently it is on its way higher for wave b. The summation is Nasdaq can move higher to test the level of 11600 over short term with support placed at 10900 (closing basis).

MCX Crude Oil and Elliott Wave Analysis

Image
 MCX Crude Oil 2 hour continuous chart Analysis From the above chart, MCX Crude Oil has started moving in a lower highs and lower lows. Recently the low of 6524 marked on 26 th September 2022 was breached indicating that Crude Oil is in stealth bear trend. In the lower panel, it is very clear that ADX has picked up momentum has is above 30 levels suggesting that the downtrend is very strong. As per wave theory, prices have completed wave B in a flat pattern and has opened wave c lower which can go till 5637 followed by 5082 which is 61.8% and 78.6% from wave a to wave b. The summation is MCX Crude Oil is negatively poised and can move down towards 5637 levels over short term followed by 5082 over medium term with resistance placed at 6954 (intraday basis).

Dow Jones Industrial Average (DJIA) Elliott Wave Analysis

Image
  Dow Jones Industrial Average daily chart Analysis As shown in the above chart, DJIA has given a bullish break in a falling channel pattern which opens positive possibilities. Currently prices are trading above this pattern and has the tendency to re-test the support (earlier acting as resistance) which falls in a range of 32800-32400. From Waves perspective, the index is moving in an impulse fashion in which it has completed wave i and can start wave ii at one higher degree which can retrace 23.6%-38.2% which falls under 32400-32000 levels. This is the area where wave ii will be completed and then wave iii on the upside will start which can go till 36400 levels. The summation is DJIA has a good support of 32400-32000 levels which can be utilized as a buying opportunity for the level of 36400 levels over medium term.

DXY/EURUSD/GBPUSD/USDJPY Elliott Wave Counts

Image
 Global Currencies daily chart DXY EURUSD GBPUSD USDJPY Analysis Dollar Index (DXY) has shown a reversal after relieve in inflation data last week. The index was moving in an expanding diagonal and potentially has completed wave v which now open fresh leg on the downside. The fall in DXY will help its peers to move higher which I have explained in detail. DXY will plunge towards its next support placed at 140-103 levels over short term. EURUSD constitute 57.6% of Dollar index, the recent inflation numbers from US has come down from 8.2% to 7.7% indicating that FED has been successful in taming the inflation after incessant rate hikes. From Waves perspective, prices have completed (w-x-y) pattern and has then started moving higher in impulse fashion where it has completed wave i and wave ii and has unfolded wave iii higher which can go till 1.07-1.09 levels. Moving averages has also given a bullish crossover after March 2022. GBPUSD which completed its complex correction in a side

MCX Copper Elliott Wave Analysis

Image
 MCX Copper hourly continuous chart Analysis From the above chart, MCX Copper has moved above the falling red channel and has discontinued the lower highs and lower lows formation. At present it has crossed its previous high of 685 levels and has closed above it thus opening further positive possibilities. Prices are likely to continue the Bull Run and can reach 750-770 levels, currently it is trading at 703 levels. In the lower panel I have added ADX which is showing immense strength in the recent uptrend. At present it is at 40 levels in hourly chart but in daily it is close to 20. As per wave theory, prices have completed wave i and wave ii and currently it is moving in wave iii in which wave iii is extended. Prices are likely to reach 261.8% of wave I to wave ii which is placed at 770 levels. The summation is MCX Copper is positively poised and can reach towards 750-770 levels over short term with support placed at 660 (closing basis).

Bank Nifty Elliott Wave Analysis

Image
 Bank Nifty daily chart Bank Nifty 120 mins chart Analysis As shown in the above daily chart, Nifty Bank continues to consolidate near the resistance zone (red line) which is an indication that there is an overhead supply placed. However, this resistance zone can be tested back again and the index can reach near to this level as mentioned earlier. There is enough room for RSI to move higher as it is well below the overbought terrain. Moving averages are favoring the index more than Nifty earlier. From 2 hour chart, Bank Nifty continues to move in a sideways direction not moving below the support level of 40670 which was mentioned in my earlier report. Currently it is moving in a triangle pattern and once this pattern is over prices are then expected to move in the positive direction. The recent sideways action has curbed the volatility which made Bollinger Bands to contract, giving an indication that there can be a breakout soon. RSI has taken the support of the center line. As p

Nikkei 225 Elliott Wave Analysis

Image
 Nikkei 225 daily chart Analysis As shown in the above chart, Nikkei is moving directionless especially after making high in February 2021. As per traditional technicals, the index is moving in a diamond shape pattern and it seems that there can be a bounce which can take prices near to 28000-28400 levels The pickup in volumes recently has indicated that prices are well supported at the bottoms placed at 25500 levels. From Waves perspective, the index is moving in a diametric pattern which has seven legs in it (a-b-c-d-e-f-g). Recently it has completed wave e near 25500 levels and it has now unfolded wave f on the upside which can go till 28000-28400 price range. The summation is Nikkei 225 is positively poised can move near till 28000-28400 resistance zone over short term.

MCX Aluminum revisited and Elliott Wave Analysis

Image
 MCX Aluminum 2 hour continuous chart. Analysis. In my previous update I had mentioned for MCX Aluminium that it will test the level of 199 when it was trading at 204, it plunged till 190 levels - Anticipated Happened To view my previous article on MCX Aluminum click on the below mentioned link https://www.marketanalysiswithmeghmody.com/2022/10/mcx-aluminum-elliott-wave-analysis.html From the above chart, MCX Aluminum tumbled as expected and reached lower till 190 levels thereby achieving my mentioned level 198 (covered in my previous report). Currently prices are moving in a stiff range of 190-210 levels. It is imperative for the metal to close above the resistance which will open further positive possibilities. In the lower panel I have added ADX which is showing strength of the recent trend, it currently stands above 20 and can move back till 35 as prices are positively poised. As per wave theory, prices have completed wave i and wave ii in complex correction, it has started w