Posts

Nifty Elliott Wave Analysis

Image
 Nifty daily chart Nifty 120 mins chart From daily chart, the benchmark is likely to face resistance of 18000-18100 going ahead. Also I have been applying Ichimoku cloud for so long. Despite of moving towards 18000 levels last week the cloud is still giving negative signal (highlighted in circle). Still the moving average has not given a bullish crossover. RSI is inching towards the overbought terrain. With all these hindrances, it is advisable to go long when it is crossed decisively. One can also wait to see if 17200 is broken on the downside. In 2 hour chart, it is now evident that 18100 is a crucial resistance. The index is hovering near to it and it is forming a diamond pattern near to it. This pattern can be a continuation pattern and also a reversal pattern. To trade this pattern it is important to see on which direction the breakout occurs. The target of the pattern on the upside comes to 15800, only when Nifty breaks the level of 17200. If prices break the level of 18000, th

Bank Nifty Elliott Wave Analysis

Image
 Nifty Bank Daily chart Nifty Bank 120 mins chart Analysis As shown in the above daily chart, Nifty Bank unlike Nifty has shown strength and has reached close to its previous high. With moving averages giving positive signs and MACD still exhibiting buy signal, there is enough room for the indices to move higher going ahead. From 2 hour chart, Bank Nifty continues to move in a positive direction and has the tendency to move near to its previous high of 41800. Price ROC has arrived near to its previous support though below the center line but this level is been tested several times. As per Wave theory, I am expecting flat pattern (a-b-c) where wave b is ongoing within which wave c is soaring the price. At present it has completed wave iv of wave c of wave b and wave v of wave c of wave b is pending on the upside. The summation is Nifty Bank is likely to move near till 41800-42000 levels as mentioned in my previous update with support at 40670.

Hang Seng Elliott Wave Analysis

Image
 Hang Seng daily chart Analysis As shown in the above chart, Hang Seng is moving precisely in a falling channel and has arrived near crucial support. There is a high possibility for the prices to move higher from current levels as downside looks limited. RSI has started exhibiting positive divergence which supports my view that the index has a limited downside. This does not mean that the trend of the index has changed, but a counter trend is in offing. From Waves perspective, it is very clear that prices are moving in a triple correction (a-b-c-x-a-b-c-x-a-b-c). Where wave a of the third correction is completed and wave b is likely to unfold soaring prices near till 16800-17000 The summation is Hang Seng can start a counter trend which can surge prices near till 16800-17000 levels over medium term.

MCX Silver and Elliott Wave Analysis

Image
 MCX Silver daily continuous chart Analysis From the above chart, MCX Silver has given a bearish break in a symmetrical triangle pattern, post that prices continued to move in a sideways direction particularly in a range of 62500-50000. This time prices are poised to move down and break the level of 50000 decisively. With lower highs and lower lows still intact, the continuation of the downtrend will lead prices near till 40000 over medium term. In the lower panel I have added ADX which is showing that the recent countertrend which lead prices near till 62500 has no strength. Currently it is below 20 and I firmly believe that it will start moving above 20 when the major trend starts. As per wave theory, I think prices have completed wave i and wave ii and has started moving down in wave iii which is extended (debatable) so this downmove of wave iii can reach the target of 43000 over medium term which is 100% of wave i, if it is extended then it can further tumble towards 161.8% o

Nifty Bank Elliott Wave Analysis

Image
 Nifty Bank daily chart Nifty Bank 2 hour chart Analysis As shown in the above daily chart, the benchmark has closed well above the upper Keltner channel which is a positive sign and can move higher from current levels. Along with that the short term moving averages are positively poised as they have given a bullish crossover. As far as prices cross its previous day high the bias for the index remains positive. From 2 hour chart, prices continues to move precisely in a rising channel formation, giving an indication that the trend is positive. There are high chances for prices to open with a gap up, for Nifty as well. It is advisable to trade keeping the stop below the low of the gap. I have applied momentum indicator which signifies that it is well supporting the prices in the positive direction. As per Wave theory, since it has overlapped which I thought it would not has forced me to change my wave counts. A flat pattern like Nifty will be well suited in which wave c is ongoin

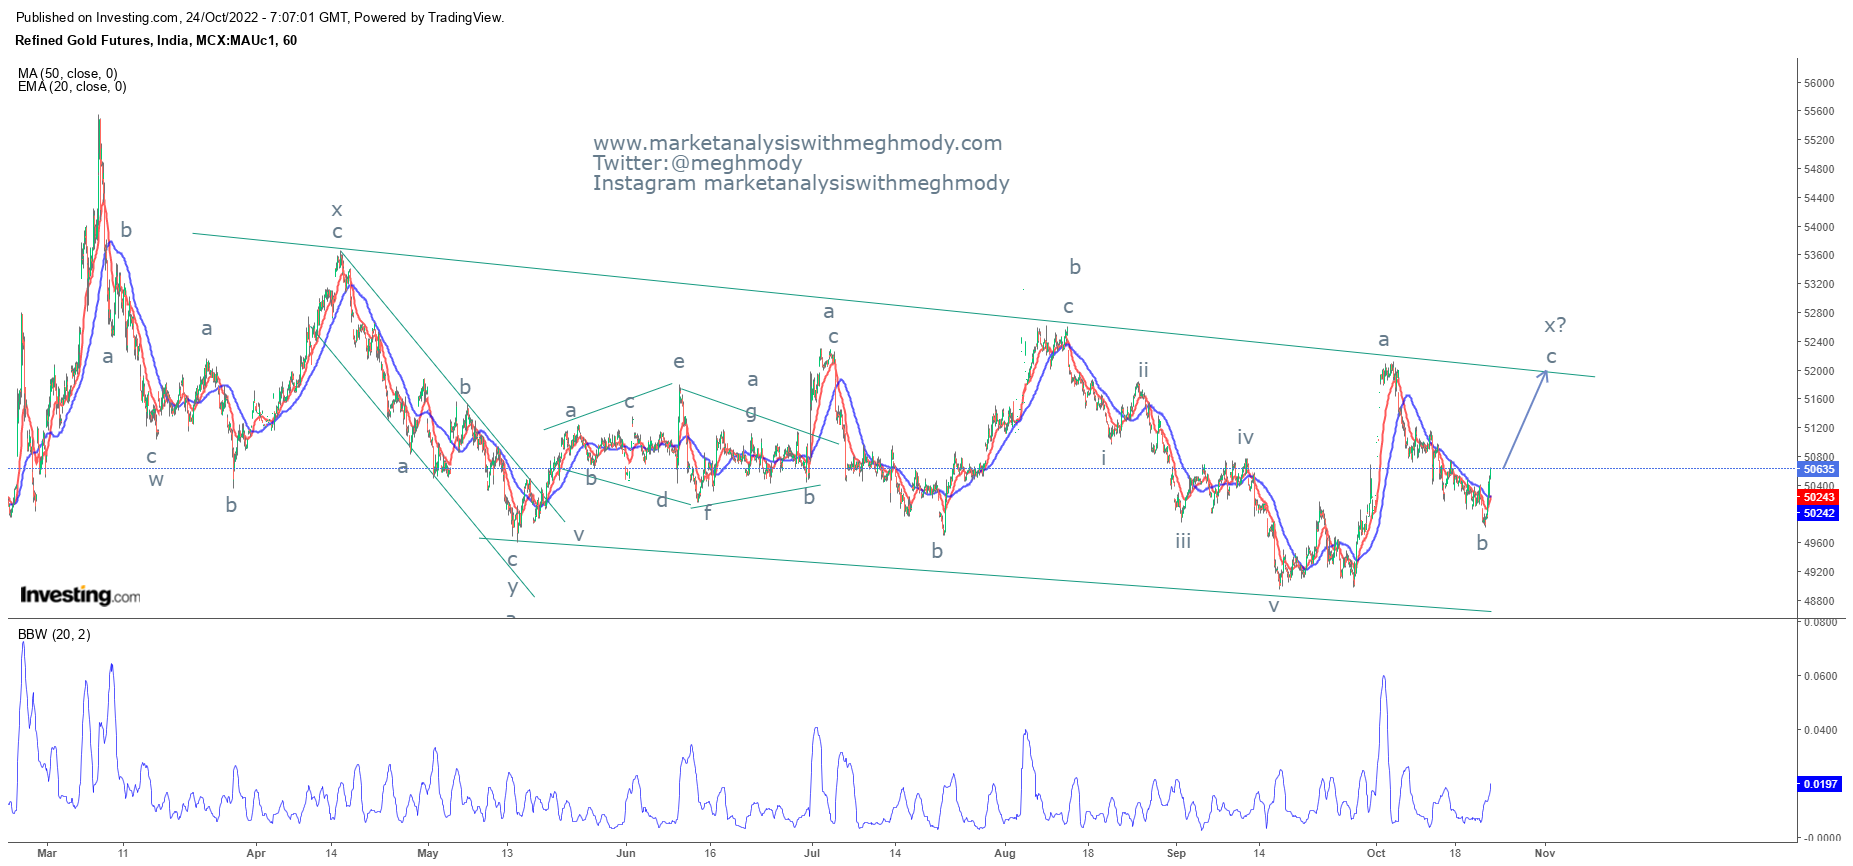
MCX Gold and Elliott Wave Counts

Image
  MCX Gold hourly continuous chart Analysis From the above chart, MCX Gold has started picking up momentum after moving down from 52000 to 49600 levels. The yellow metal has now climbed above 50600 and can possibly move or test the falling trend line which is placed at 51800 levels. On the lower panel I have placed Bollinger Width which indicates that the Band is expanding as it moves higher from 0 levels. Every time it has started moving higher, prices have shown good amount of rally. As per wave theory, the yellow metal is moving in double correction where it is currently moving in wave c of wave x. Wave c is impulse in nature and can move near till 51800-52000 levels over short term. The summation is MCX Gold can test the levels of 51800-52000 over short term with support placed at 49800 (closing basis).

GBPINR Elliott Wave Analysis

Image
 GBPINR 4 hour chart Spot Analysis Cable has been in the limelight off lately after the new PM of UK has started quantitative easing by buying bonds. Last week, UK Finance Minister was sacked after Tax fiasco, thus making the markets quite volatile and so as its currency. As seen in the above chart, the pair has smartly recovered from the bottom of 84 levels and now holds the level of 92, this level is been tested twice and there is a possibility now for the pair to test the support which is placed at 90. RSI has reversed from the overbought terrain and can move back towards the oversold territory over short term. Wave theory suggests, after completing wave v of wave c lower, prices might have started a corrective wave or an impulse, where it has completed wave i/a at 92 and now moving down to complete wave ii/b. The summation is GBPINR can dip near till 90.30-90 levels over short term as far as 92 holds on closing basis.