Posts

Showing posts from March, 2020

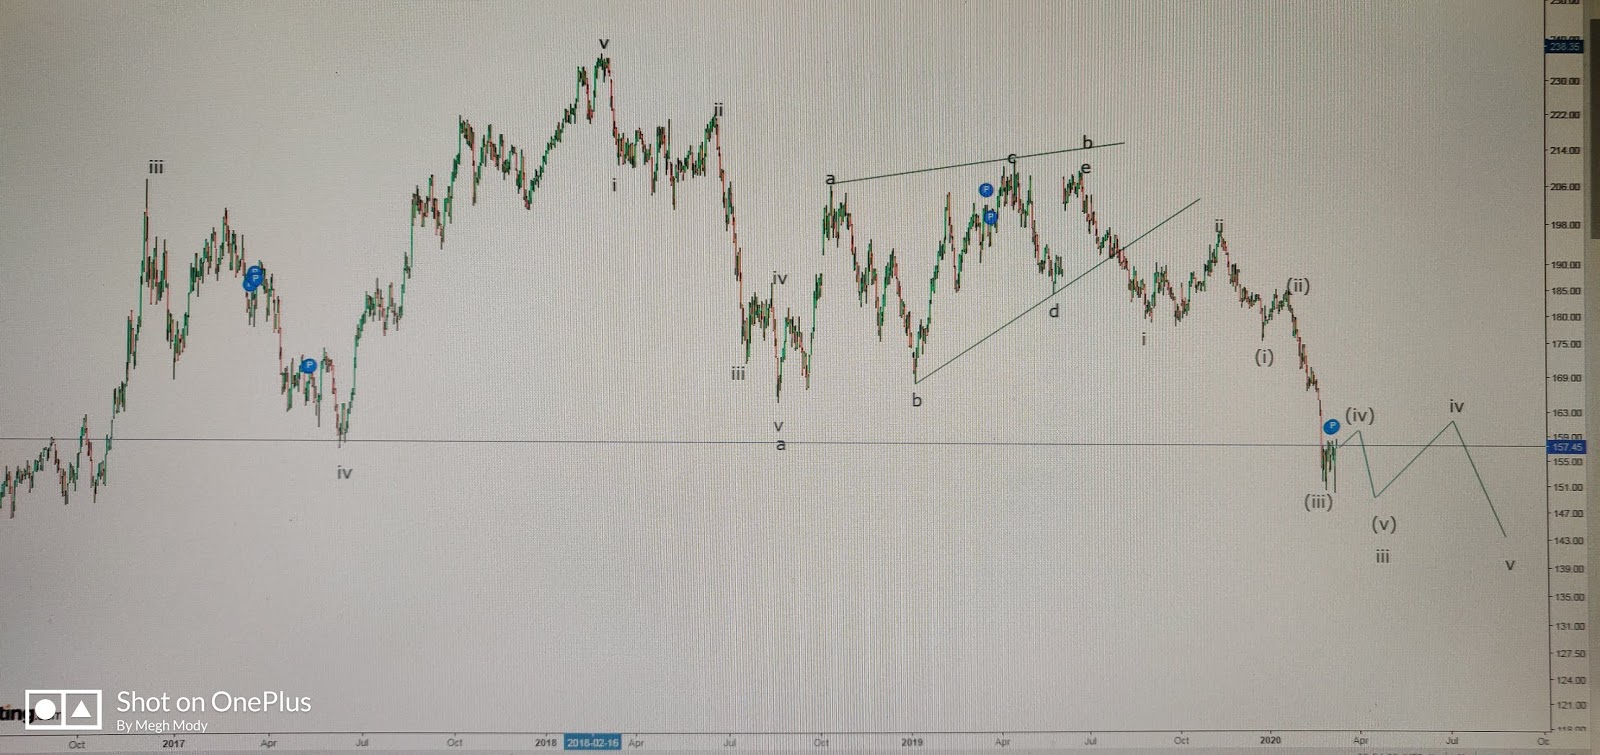
Zinc mini ElliottWave forecast

Image
In the above daily chart of Zinc mini, prices are moving down in a lower high and lower fashion especially after making bearish head and shoulder pattern. As of now prices have gone down to test the level of 140, but there is a resilience coming from lower levels. There is a high possibility for prices to move near to 146-149 levels where the resistance of the big falling channel is placed. However, MACD histogram is still in negative territory. As per wave theory, the base metal has either completed wave iii or on the brink to complete wave iii which will open wave iv higher near to 146-149 levels followed by wave v lower. The summation is, prices are expected to take a breather which can soar it near till 146-149 levels as far as level of 139 is intact on the downside. Learn ElliottWave and NeoWave in my 4 day course. Classroom training and webinar both available. Classroom training is in Mumbai at Vile Parle and Borivali near station. The fees for the same will be R

Nifty: Elliott Wave forecast

Image
Nifty Daily chart Nifty hourly chart Nifty has witnessed some easing after dynamic fall in last one month. Prices have shown strength at the end of the previous week which is giving some hope to the bulls. However, it will be early to say that it is a reversal. Nifty has reversed from 80% of the previous up move (marked with black horizontal line) which was 7500. From there it moved up and conquered 9000 mark but closed at 8660 levels. There are chances that it will move down from current levels and test 8500-8400 levels but it will not go below 7500. After testing the above level prices are poised to move higher. RSI is relieving from the oversold zone. From hourly chart, the index had seen overhead supply at 9000 mark which dragged prices way lower after breaking the falling channel. As of now it is moving above the rising trend line as can be seen in the chart. It is possible for it to break this trend line which can be termed as bear trap and then it will surge.

MCX Silver: Elliott Wave Forecast

Image
MCX Silver Daily chart MCX Silver hourly chart As shown in the daily chart of Silver, prices have seen resilience from the lower levels where cluster of supports were placed (marked by horizontal black line).The bounce from the support seems to be strong and it is unlikely that it will fade soon. RSI in daily has started moving higher bouncing from the oversold territory. In hourly chart, the bullion has started moving in a higher highs and higher lows which is a positive sign. Also RSI has relieved from the oversold zone which can now move prices higher. As per wave theory, Silver has completed wave b of wave b and is now moving in the form of wave c of wave b which is impulse in nature. The possibility for prices to react near till 100% of previous wave a is likely. The summation is Silver is poised to move higher near till 49200-49300 levels with the support at 38900 levels. The bias is firmly positive for Silver over short to medium term. Learn Elliott W

USDCAD anticipated happened with ElliottWave

Image
You all can learn ElliottWave and Neo Wave with me on my 4 day course while everything else is closed due to Corona virus which is a pandemic disease. This course you can learn via webinar and after learning you can assess market movement and forecast with accuracy. Over 20 hours course with practical application. Make use of free time into educational time. Call +919324174580 for inquiry and registration.

USDINR: Topping process underway with ElliottWave forecast

Image
As shown in the daily chart of USDINR, prices continue to move in a positive direction as by crossing its previous highs which is a positive sign. Last week it failed to move below 73.8 and as a result prices moved higher, thus indicating that the trend is positive. I would recommend to stay cautiously positive for this pair. In hourly chart, Prices are moving in a rising channel, as far as prices persist in this channel the bias continues to be positive. Only breach of this channel will on the downside will open negative possibilities. It is imperative that prices break the level of 74.55-74.5 which can drag prices lower. RSI continues to exhibit negative divergence. As per wave theory USDINR is either moving in a zigzag pattern or an impulse fashion. The best way to know is its internal counts. As of now wave v of wave c/iii has started and can end soon as it is near to 100% of wave a/i. Once this ends and the level of 74.55-74.5 is broken, prices will start new leg dow

EURINR ElliottWave forecast

Image
EURINR on the daily chart is moving down by breaking its previous day low and failing to cross its previous day high (closing basis), this represents that the pair is in stealth downtrend and can even move down further. RSI is below 50 now which means it is in negative terrain. In hourly chart, prices can move higher from current juncture and will face resistance at 81.20-81.3 levels. Once it will comes close to the hurdle there will be resumption of the major trend which is down. Prices are poised to break its previous low of 80.34 and can falter near till 79.3 to 79 levels. RSI in hourly chart has relieved from oversold terrain and can change direction soon. As per wave theory, the pair has started moving down in wave iii which is extended, this will also open wave iv and wave v lower. The summation is, prices will continue to plunge till 79.3 to 79 levels with resistance placed at 81.2-81.3.

GBPINR: Anticipated Happened and ElliottWave forecast

Image
GBPINR continuous daily chart GBPINR Continuous daily chart In my previous update dated on 16th March 2020, I had mentioned, “prices are firmly in a negative trend and can stumble till 92 followed by 91 with crucial resistance placed at 95.30.” The pair failed to move above 95.3 and opened with a gap down on Monday accelerating the selling pressure which dragged prices lower till 86.23 levels thus achieving my mentioned level- Anticipated happened. From above chart of GBPINR, prices bounced from the low of last week and closed much higher than the close. It is to my knowledge that prices have relieved from the oversold terrain and can resume its downtrend. The gap of Thursday was filled on Friday which is also likely to face the resistance. As per wave theory, I think wave iv is on the brink to complete and wave v will move down very soon. It is unlikely for the price to move above 90.1. The summation is, the pair will reverse the direction to shed all the

Nifty: what's next as per Elliottwave theory?

Image

GBPINR: ElliottWave forecast

Image
GBPINR continuous daily contract From above chart of GBPINR, prices are trading near the support of the lower trend line. However, this trend line will not give any support but will break it which will infuse selling pressure dragging prices till it’s cluster of supports. As per wave theory, wave c has terminated at 50% from wave a to wave b. At 98.13 prices completed wave b at one higher degree which opens wave c down which can tumble till 92.  Once 92 is breached it can falter till 91 which is 50% of entire wave b. The summation is, prices are firmly in a negative trend and can stumble till 92 followed by 91 with crucial resistance placed at 95.30.

Hang Seng Anticipated Happened video YouTube

Image

MCX Zinc Mini Elliott Wave forecast

Image
MCX Zinc M daily chart Zinc mini is moving in a lower high and lower low formation which is a negative sign. Also to notice prices have give a bearish Head and Shoulder break, this opening negative possibilities. From wave perspective, prices are moving in wave c of wave (a-b-c). Wave c is impulse in nature, in which it is moving in wave iii which is extended. After completing wave (iv) of wave iii it will break it's previous low of 149.90 and complete wave iii then wave iv higher will start which can soar prices near till cluster of resistances placed at 159-160 and then again wave v of wave c will move near till 147-145 range.

Nifty ElliottWave forecast YouTube video

Image

MCX Crude Oil Elliott Wave Forecast

Image
MCX Crude Weekly chart In my earlier articles about Crude Oil I had been mentioning for the level of 3000 down once the level of 3500 was broken. When this level was breached it came down till 2151 after there was no out come from Russia and Saudi Arabia. From ElliottWave analysis, I think that wave b is over in a regular flat pattern which will now open wave c up. This wave c will be impulse in nature and can move till 5600 and complete another way e at one higher degree. Learn ElliottWave and Neo Wave analysis with me in my 4 day course in Mumbai, classroom training available. If you are not in Mumbai webinar is available. The cost will be INR 10,500/- or $155. For registration or inquiry call +919324174580.

Hang Seng Anticipated Happened ElliottWave forecast

Image
Hang Seng Daily chart anticipated on 31st Dec 2019 Hang Seng Daily chart happened on 9th March 2020 In my previous update dated 31st Dec 2019 I was sure enough to say that 29200 will be the capping for this index and thereafter it can falter till 26000-25000 as the entire wave structure is a triangle and moving in wave B in which it has completed wave d and now wave e up will start. Here is the link of my earlier update on Hang Seng https://www.marketanalysiswithmeghmody.com/2019/12/hang-seng-possible-triangle-pattern-and.html Now I am open to 2 scenarios one is the triangle other is w-x-y which is completed and wave c down has started. If triangle then wave e up is pending from hereon.

Nifty Elliott Wave forecast

Image
Nifty weekly chart After the Union Budget Nifty has corrected bit it was short lived as it quickly conquered 12000 one next few sessions. However not many could see that it was trading near the channel resistance, there was also a distribution pattern seen which just got completed. Let us see now what is next for Nifty with help of Elliott Wave theory. It completed ending diagonal pattern and it seems that wave 3 is over which opens wave 4 down. This wave 4 can retrace in-between 38.2-50% of wave 3 which can come to 8500-7350 respectively. Once this is over wave 5 on the upside will start.  So I am expecting Nifty to falter near till 8500 (long term forecast).

Russian Rouble Anticipated Happened video

Image
Video Learn Technical Analysis in 4 month course and become independent financially. It will be conducted once in a month and the fees will be INR 12000/- if you want to learn Elliott and Neo Wave, a four day course the fees will be INR 10500/- classroom training and webinar available. For inquiry and registration contact +919324174580.

USDINR YouTube video

Image
I have anticipated the entire move, this prognostics can also be done by you, all you have to do is learn ElliottWave NeoWave with me in my 4 day course in Mumbai. Classroom training and or webinar are available for it. The course fee will be INR 10,500/-. For inquiry and registration call +919324174580.

MCX Gold: Anticipated Happened

Image
MCX Gold Anticipated on 31st Dec 2019 MCX Gold Happened Mar 2020 In my previous update I had mentioned that, " Prices have recently given a breakout and it is in wave 3 which is extension within extension as seen in the above chart. This means that wave 4 down and wave 5 higher both are pending. If everything is in place in next year Gold can test 44000-45000."- Anticipated Happened Prices reached a high of 44960 yesterday, it was quoting at 39170 when I had written the article. Here is the link check it out. https://www.marketanalysiswithmeghmody.com/2019/12/mcx-gold-elliott-wave-forecast-and.html What is next in gold? well you can learn to find by yourself as Technical Analysis classes is going to start from 21st March 2020- classroom training in Mumbai, 4 month course. Contact +919324174580. If you want to learn Elliott and Neo Wave it will be 4 day course both classroom training and webinar available. Contact +91932417580

USDINR: Revisited

Image
USDINR Anticipated on 24th January 2020 USDINR Happened on March 2020 In my previous updated dated 24th January 2020, I had been mentioning that prices are poised to go up which means INR will weaken against US Dollar. I was not bullish from the month of January infact I was from December 2019 itself. However, change in price patterns forced me to change the wave counts but not the view. Here is the two link which I am sharing in which I was mentioning for the level of 73-73.5. Click on it https://www.marketanalysiswithmeghmody.com/2019/12/usdinr-re-visited-and-elliott-wave.html https://www.marketanalysiswithmeghmody.com/2020/01/usdinr-change-in-wave-counts-but-not.html This is not magic but analysis which I am doing by combining advance technicals with other technical tools. You can learn with me in my 4 month course where I teach Technical Analysis. For inquiries contact +919324174580 Learn Elliott and Neo Wave analysis in my 4 day course classroom training an