MCX Copper: Elliott Wave Slanting triangle
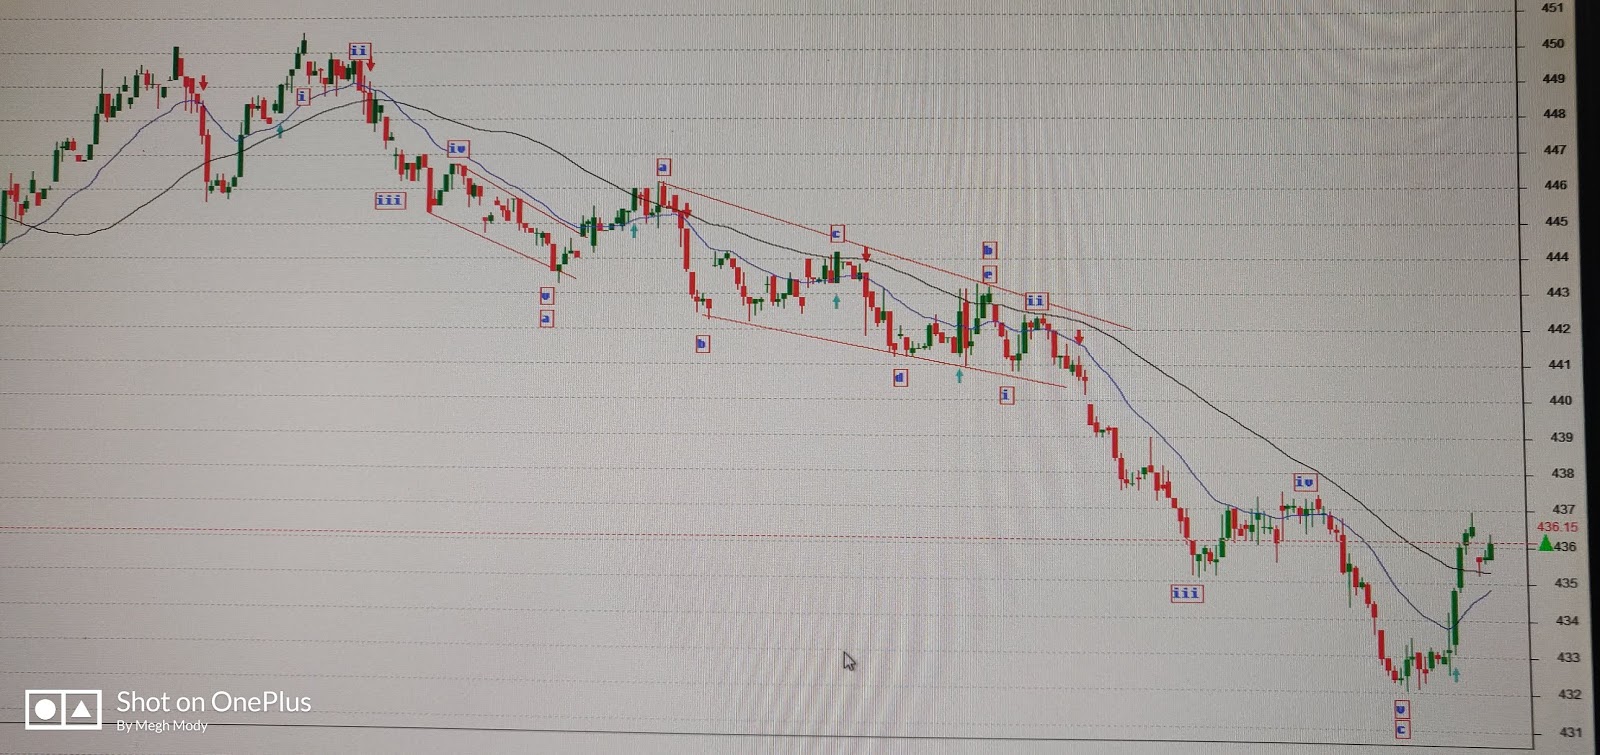
MCX Copper 60 mins Dec chart From Elliott Wave perspective, MCX Copper completed one bigger corrective wave (a-b-c). In wave wave five Waves are seen and it also terminated near to 161.8% of wave a to wave b. Wave b in the above chart formed a Slanting triangle which is unique and not seen often. Not so long ago, I had written an excerpt on MCX Copper in which I had mentioned that it will come down near till 420 levels which can be utilised to buy for the level of 470-475 levels. Check this link to view the excerpt. https://www.marketanalysiswithmeghmody.com/2019/10/mcx-copper-all-set-to-soar.html Learn Elliott-Neo Wave, a 4 days webinar/classroom training in which entire theory along with practical application will be explained. The fees will be RS 12500/-. For registration call +919324174580