Posts

Showing posts from October, 2015

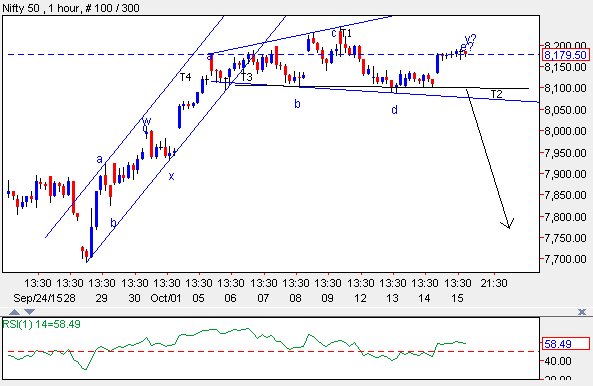
Nifty on the brink to reverse

Image
Nifty is currently approaching near cluster of resistances which is long term downward sloping red trend line and 200 DMA placed at 8380 levels. As of now there is no reversal in this index, but the momentum on the upside seems to exhaust. A trend reversal will occur only if the level of 8200 is taken out followed by 8100 which is the previous lows. It is imperative for prices to reverse as it is moving precisely in a downward sloping red channel since the top was made at 9119 levels. At present it is hovering near the resistance of the red channel. However, there is no reversal on daily chart or any smaller time frame. On 60 mins chart, prices are moving in a positive direction by forming a higher highs and higher troughs. As of now it is quoting at the resistance of the upper trend line, it is also failing to cross it decisively from past three trading sessions (EOD) giving an indication there no vacuum on upside. An expanding triangle can also be seen on hourly chart. As

AUD/NZD: Impulse wave and reversal on Monthly chart

Image
After forming an ending diagonal in AUD/NZD on the monthly chart shown below from 2006 till mid of 2011, prices thereafter reversed and started moving in a negative direction breaking its previous troughs. In the month of April 2015 the pair made a low of 1.000 and reversed its direction. It gained for consecutive three months, crossing its previous high of 1.1304, thus opening positive possibilities. In the fifth month from the bottom, prices made a monthly high of 1.683 but failed to give a trend line break thus reversing its winning streak. Currently the pair is approaching near the channel breakout particularly known as throwback. As per wave theory, after completing an ending diagonal pattern, prices commenced downward journey in an impulse fashion. The last leg ended at 1.000 which is wave v. The current leg is corrective in nature which has three legs in it (a-b-c). As of now it is moving down in the form of wave b, and has retraced 61.8% of the previous up move. Break b

WTI Crude to surge going ahead

Image
On Wednesday eve OPEC members and non members meet was scheduled to discuss on risk to oil investments. The low oil prices is  risk as investments would hamper in new supplies. There was no out put cuts in the meet. Technically speaking, WTI crude oil prices are moving in a higher high and higher low formation after forming a low of $37.75. The current fall is just a reaction of main trend. As of no the trend is positive for Crude. As per wave analysis, from the bottom till $49.32 marked on 31st August 2015, the entire formation was an impulse wave, which is marked as wave a. The following wave was a sideways movement and was then formed as a triangle pattern, marked as wave b. After completing wave b, prices moved higher and formed wave c at $50.13 on October 12, 2015. The entire three wave structure can be marked as wave a of one higher degree or (a-b-c) pattern. The following down leg can be wave x or wave b of one larger degree. We will closely monitor the movement in Cru

Bank Nifty: In an Ending Diagonal pattern

Image
On 21st Oct 2015 major indices like Nifty, Bank Nifty and Sensex were highly volatile after the crash in Chinese market. It is always the structure that forms first followed by news/events (good/bad). In the previous update Nifty in an expanding triangle, upside seems to be capped was mentioned. In the below Daily chart of Bank Nifty it is clearly visible, that prices have discontinued the higher highs and higher troughs which is negative sign. RSI has also exhibited negative divergence which suggest that the momentum on the upside will exhaust soon. As per wave theory, after completing of wave a and wave b of one higher degree wave c was an ending diagonal. Ending diagonal (wedge) have five legs which is a motive wave. After completion of wave v, the post pattern impact was steeper dragging prices below the upward sloping trendline. In short, any move below 17430 will open negative possibilities for this index which can drag prices near till 15550 levels. Nifty daily

Gold in a complex correction pattern.

Image
From the top of $1920 marked on 5th September 2011 prices failed to sustain at higher levels, eventually resulting in a crash. Currently it is trading at its three month high from the bottom of $1076 at $1176 per ounce, but it seems that this rally will fail going ahead.  Technically speaking, gold is moving in a negative direction forming a lower high and lower trough. Prices are also moving precisely in a downward sloping channel. The recent bounce have already retraced 50% of the previous fall, it can also retrace 61.8% placed at 1219 levels which is closer to the resistance of the channel . However, the momentum will fail to support prices which will mark a reversal. As per wave theory, prices are moving in a complex correction (W-X-Y) within which Wave W was a three wave pattern, wave X was a triangle and wave Y which is ongoing seems to be a double correction (a-b-c-x-a-b-c). Currently it is moving in wave c of wave b of the second correction in which it has completed t

Nifty in an expanding triangle pattern ( Elliott Wave Analysis)

Image
The recent bounce in Nifty was quite surprising for many traders especially after global markets were melting down on the back of speculation over rate hike by Fed and slow down in China. Nifty failed to move down further, finding support at the lower trend line placed at 7540 of the channel and marked a high of 8243 levels. Currently the rally seems to exhaust as it is moving in a expanding triangle pattern. A triangle has five legs, each are corrective in nature (3-3-3-3-3). Today it started its fifth leg which can move above 8243 or can even fail to cross it. A triangle at the top indicates that the rally is over, as the entire upmove itself is corrective in nature (w-x-y). Nifty needs to break the level of 8100 decisively for negative possibilities to open. The thrust of a triangle is always sharp and will retrace faster. The possibility for a trend reversal is likely in Nifty. In short, a trend reversal in Nifty is expected only if prices move below 8100 at much fast