Posts

Showing posts from January, 2022

Shiba Inu: Road Ahead with Elliott Wave Analysis

Image
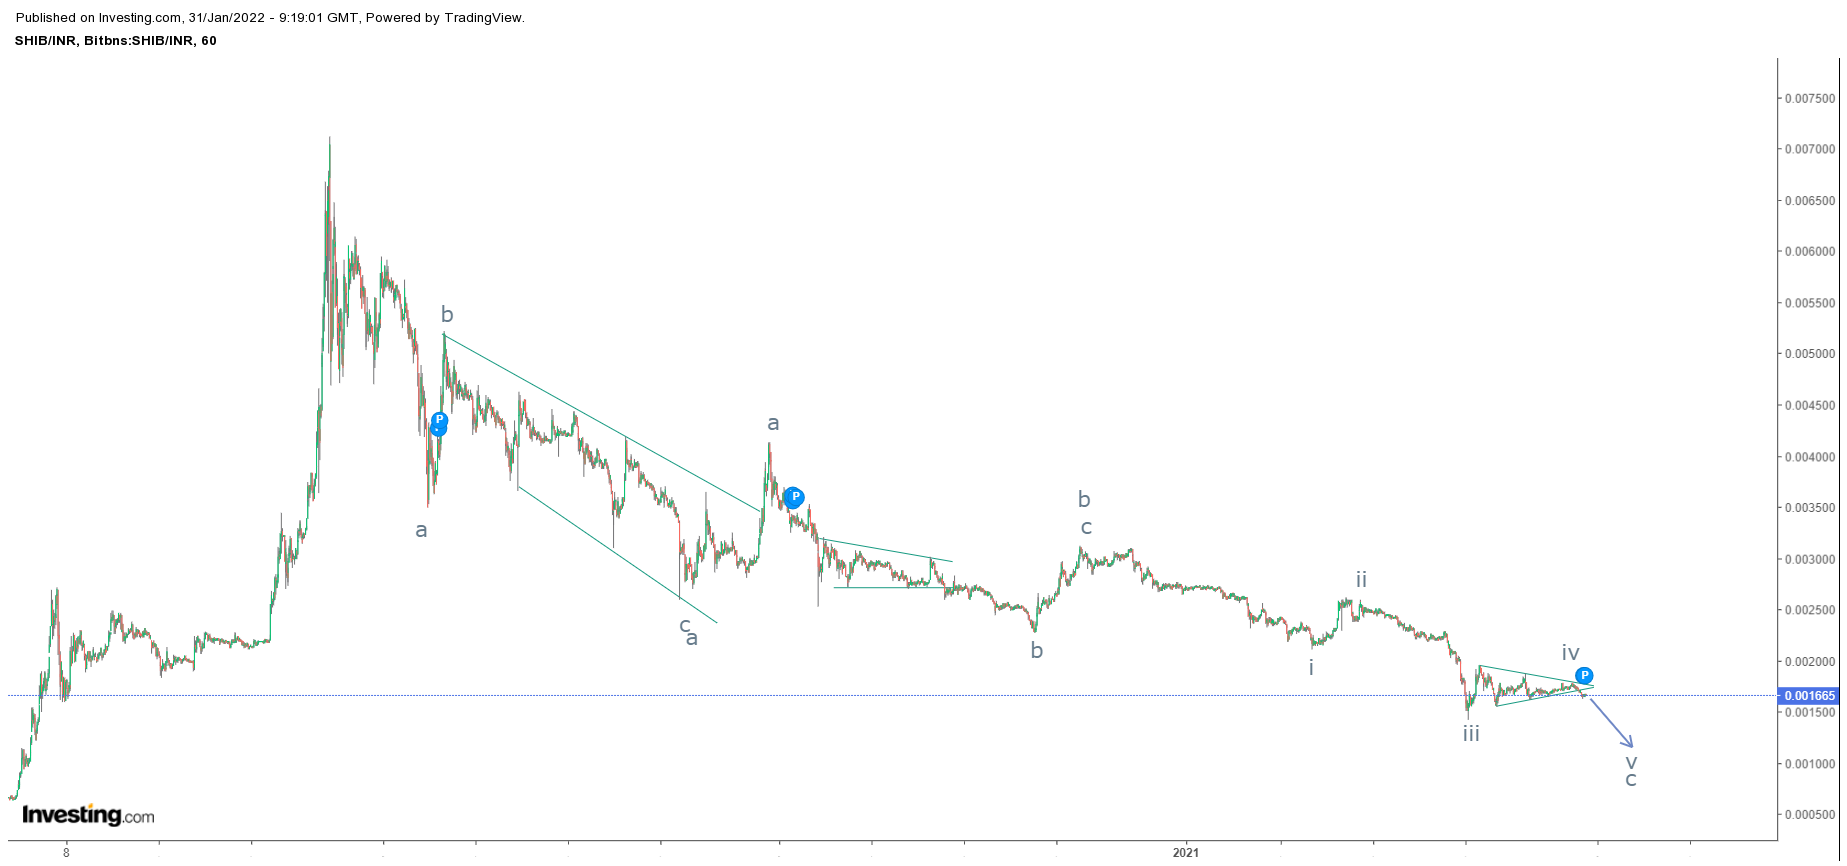
 ShibaInu/INR hourly chart As shown in the above chart, prices are moving down by breaking its previous lows which is a negative sign. By moving in a lower highs and lower lows, prices define negative trend. Currently it is moving in a sideways direction in which it has given a negative breakout. From Waves perspective, prices are moving in a corrective pattern (a-b-c) where wave a and wave b in running irregular flat is completed, wave c is in making where it has completed wave i to wave iv and wave v is pending. Wave iv is in triangle which got completed today, this opens wave v lower which can test 0.000755 INR   The summation is SHIBAINU is all set to plunge towards 0.000755 over short to medium term.

Dollar Index (DXY): Elliott Wave Forecasting

Image
 DXY daily chart From the above chart, prices continues to rise in a higher high and higher lows fashion. This change of trend is assumed to have started when FED signaled hiking the interest rate last year. Prices which were consolidating in the range of 93-90$ levels, then gave a bullish break in a double bottom pattern.  The target of this pattern is almost achieved but it seems that more upside is left. As per Wave theory, prices are moving in a impulse fashion, where currently it is moving in wave iii which is extended, it is also an observation that wave iii of wave (iii) is extended too, this means there is extension within extension. Once wave iii is done, then there will be wave iv lower and wave v which can then move till 102-105$ levels. The summation is DXY has a support placed at 94.5, as far as it is protected, prices are likely to move till 102-105$ over medium term.

Bitcoin: Revisited

Image
 Bitcoin hourly chart I have updated Bitcoin not long ago and I was into two minds that either it will bounce from $40000 levels or if broken will move towards $35000 levels. The level of $35000 is crucial as this level was tested before and from there it has made an all time high.  My view for Bitcoin is $75000 by this year as it bounce from current levels and reach towards it. This I had mentioned in my previous article as well. Here is the link of my previous article of bitcoin https://www.marketanalysiswithmeghmody.com/2022/01/bitcoin-elliott-wave-analysis.html It is imperative for prices to move above $40000 levels for the trend to change from negative to positive which will open doors for $75000. From Waves perspective, prices completed (w-x-y) pattern and will now move higher once the above mentioned level is crossed decisively The summation is BTC is all set to move higher towards the level of $75000.

Power Finance Corporation: Elliott Wave Analysis

Image
 PFC hourly chart As shown in the above hourly chart, prices are moving in a lower highs and lower lows which indicates that the trend of the stock is negative and can dip going ahead. PFC is all set to break its previous low placed at 114 levels as it faced the resistance of the falling channel and all set dip next. From Waves perspective, prices have started to unfold wave c lower after completing wave a and wave b (counter trend). Wave c can move down till 105-104 levels over short term to medium term. The summation is, PFC is set to plunge till 105-104 levels from current levels over short to medium term.

JPYINR: Completion of Triple Correction

Image
 JPYINR Spot daily chart From the above daily chart, JPYINR is all set to reverse after the support of the lower channel is tested. Also, there is a high possibility for prices to break the falling channel which will open positive possibilities and also change the trend from negative to positive. Wave theory suggests that, prices have completed triple correction pattern (a-b-c-x-a-b-c-x-a-b-c) and it is set to reverse. Over short term, prices are expected to test 66.8-67 levels, a move above this level will open further positive possibility. The summation is JPYINR is likely to move higher near to 66.8-67 levels over short term.

USDINR: Inverse Head and Shoulder Pattern and Elliott Wave Analysis

Image
 USDINR hourly spot chart As shown in the above chart, the pair is moving in a sideways direction and can possibly reverse from current levels changing direction from negative to positive. To support the above statement, it is important to see that the pair has made a reversal pattern near cluster of supports (marked by arrows). The reversal pattern is on the brink to complete once the level of 74.7 is decisively crossed. The reversal pattern is inverse head and shoulder pattern. From Waves Perspective, prices are moving in an impulse fashion after completing corrective pattern (a-b-c). In the impulse wave it has completed wave i and it is currently moving in wave ii, once it is complete wave iii can soar prices close to 75.6-75.7 levels (spot). The summation is USDINR is firmly positive and can move near till 75.6-75.7 levels once the level of 74.7 is decisively crossed and sustained.

DLF: Elliott Wave Analysis

Image
 DLF hourly chart From the above chart, prices are moving in a sideways direction, particularly in the range of 450-350 levels. Recently it faced the resistance of the range and it is falling which can lead prices towards the support of the range. As per wave theory, prices are moving in flat pattern, where the first fall was complex correction ended in wave a thereafter it went up to complete wave b (a-b-c) perfect corrective pattern. Now it is falling in an impulse fashion to complete wave c which can move down in a range of 360-350 levels. The summation is DLF is negatively poised and can falter towards 360-350 levels over short term.

Ethereum: Elliott Wave and Neo Wave Diametric pattern

Image
 ETH/USD hourly chart As shown in the above chart, prices are moving in a lower highs and lower lows and it persists in the falling channel. However, the recent low is protected and prices are likely to move higher from current levels which can give bullish break in falling channel pattern. From Waves perspective, prices moved down in a Neo Wave diametric pattern, followed by three waves up to complete wave b and then wave c lower which completes one corrective pattern. After completing the corrective cycle there are high chances for this crypto to reverse. The summation is Ethereum is all set to reverse and can test the first resistance placed at $3900 over short to medium term.

GBPINR: Triple Correction?

Image
 GBPINR Spot daily chart As shown in the above chart, prices are moving in a falling channel which gives an indication that the trend is down. Recently, cable has shown resilience from the support of the channel which can move back towards the resistance of the pattern. many analysts believe that the uptick in price is due to rise in inflation in UK but technically it was hinting ahead of time. From Waves perspective, prices are moving in a double correction which can now be turned into triple correction (a-b-c-x-a-b-c-x-a-b-c). Currently prices are in the second wave x and it is still forming which can move till 102-102.5 (spot). The summation is GBPINR is mildly positive and can fin resistance at 102-102.5 levels over short term.

Nifty Bank: Elliott Wave Analysis

Image
 Nifty Bank hourly chart From the above chart, Nifty Bank is moving in a higher highs and higher lows and it is precisely moving in a rising channel which is a positive sign. Recently prices have retraced back to test the support of the channel, any bounce from current levels will open further positive possibilities. As per Wave theory, prices are moving in am impulse fashion, in which it has probably completed wave iv in a flat pattern and it is on the brink to start wave v which can move up near to 39900-40000 levels. The summation is Nifty Bank is all set to move higher over short term near 39900-40000 levels, as far as 37400-37200 is intact on closing basis.

MCX Crude Oil Anticipated Happened

Image
 MCX Crude Oil daily chart anticipated on 28th December 2021 MCX Crude Oil daily chart happened on 19th January 2022 In my previous article on MCX Crude I had mentioned that, "  MCX Crude is positively poised and can move higher near to 6100 followed by 6400 over medium term." Within twenty trading sessions MCX Crude has achieved my above mentioned level- Anticipated Happened To read the previous articles on MCX Crude click on the below links MCX Crude Anticipated Happened and Elliott Wave Analysis https://www.marketanalysiswithmeghmody.com/2021/12/mcx-crude-oil-anticipated-happened-and.html MCX Crude Oil Elliott Wave Analysis https://www.marketanalysiswithmeghmody.com/2021/12/mcx-crude-oil-elliott-wave-analysis.html It will be important to see  how this wave will unfold, I will monitor the movement and keep you all posted.

Bitcoin: Elliott Wave Analysis

Image
 Bitcoin daily chart As shown in the above chart, Bitcoin is moving in a range of $65000-$35000 levels and it seems that prices will continue to move in this range once the lower extreme of the range is tested. To understand it more precisely, it is better to know where the support and resistance levels are placed. Currently, prices are hovering near crucial support of $40000 levels (shaded area). As far as this level is intact there is a limited downside. However, decisive break of the above mentioned level will plunge price towards $35000 over short term. From Waves perspective, prices are moving in a irregular flat pattern but with slight complication. So this cannot be a irregular flat pattern as I can see only (3-3-3) so I will open running triangle as my other favorable probability. If triangle is not formed I will sum up with (w-x-y). I will monitor the counts and will keep you all posted. Also the final outcome after the pattern is complete will lead Bitcoin to new highs minimu