Dollar Index (DXY): Elliott Wave Forecasting
DXY daily chart
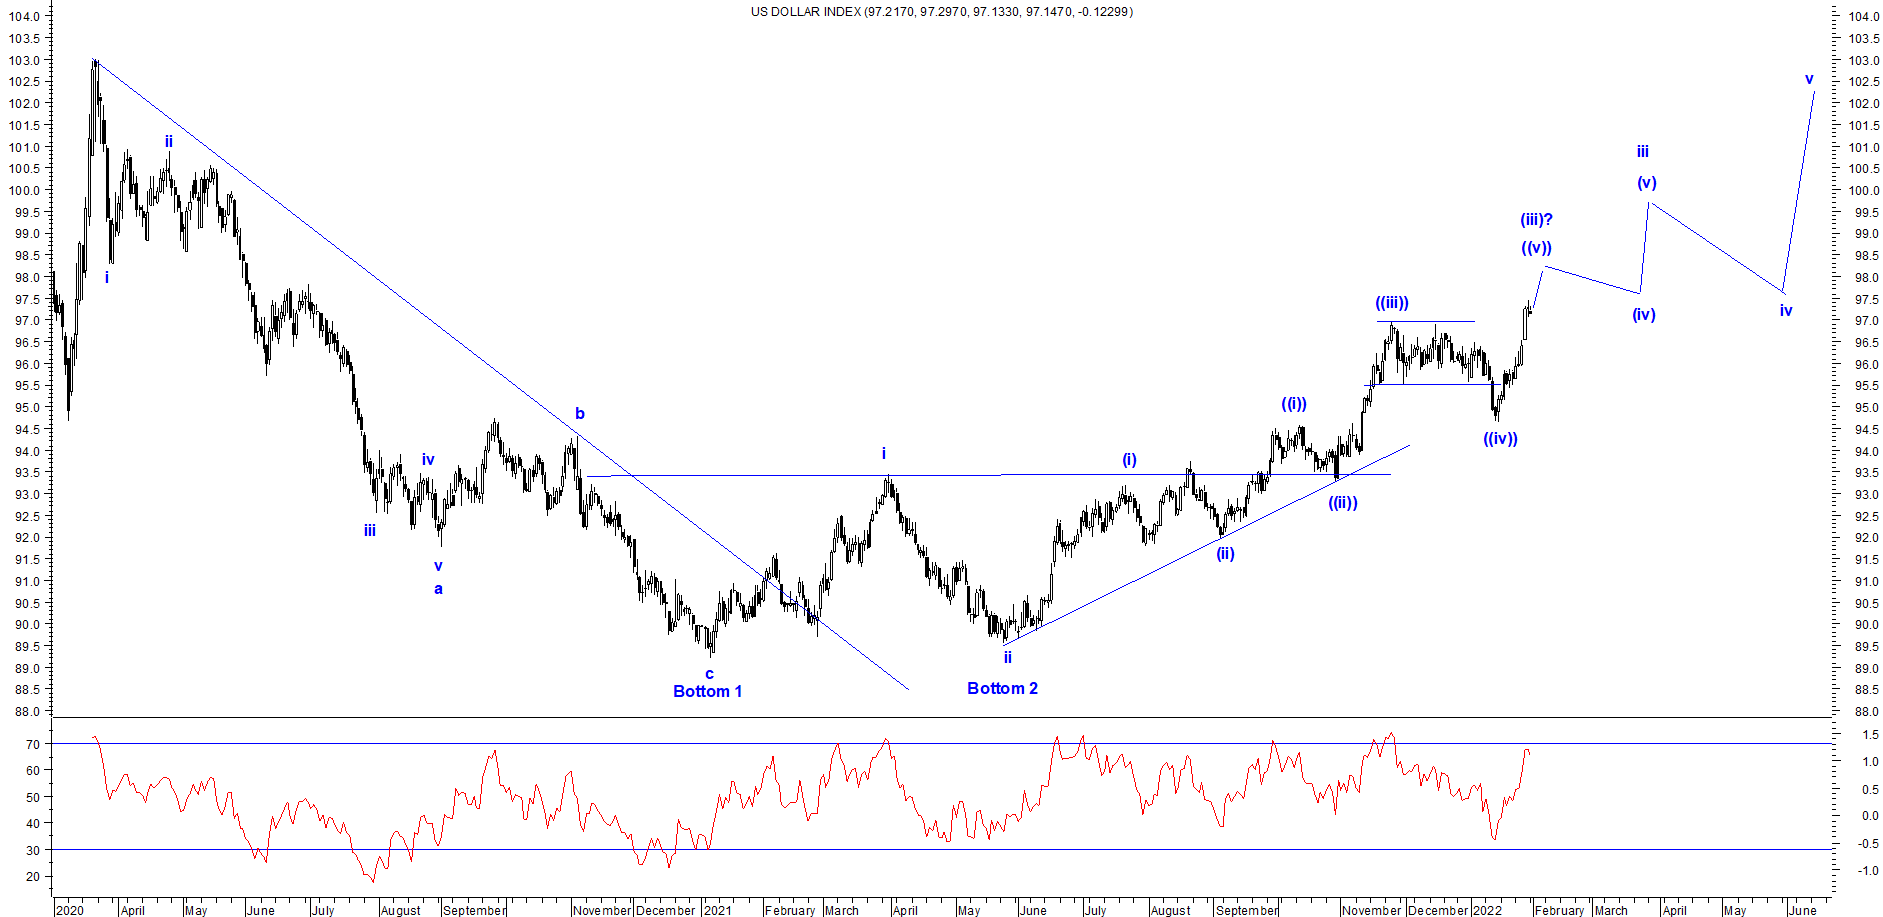
From the above chart, prices continues to rise in a higher high and higher lows fashion. This change of trend is assumed to have started when FED signaled hiking the interest rate last year. Prices which were consolidating in the range of 93-90$ levels, then gave a bullish break in a double bottom pattern. The target of this pattern is almost achieved but it seems that more upside is left.
As per Wave theory, prices are moving in a impulse fashion, where currently it is moving in wave iii which is extended, it is also an observation that wave iii of wave (iii) is extended too, this means there is extension within extension. Once wave iii is done, then there will be wave iv lower and wave v which can then move till 102-105$ levels.
The summation is DXY has a support placed at 94.5, as far as it is protected, prices are likely to move till 102-105$ over medium term.


Comments