Posts

Showing posts from July, 2019

Lead and Zinc: Positive to negative correlation

Image
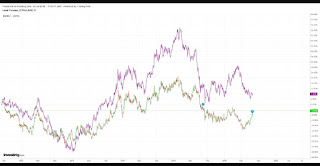
Daily spread chart Lead and Zinc has been moving in sync but from few months the correlation has been negative as Lead is moving up but zinc is failing to show strength. This can also be interpreted as Zinc is possibly forming a basing formation and is on verge to reverse the trend so that to be in tandem with the other. In short, Lead is showing strength but zinc is not, the trend for zinc can change which will make a positive correlation going ahead.

Bitcoin to conquer 13000

Image
Bitcoin hourly chart Bitcoin this month till 13700 levels but it was short lived as prices then broke 10000 levels and ended in 4 digit number. However it seems that it wont go below 9000 in near term but can definitely conquer 13000 in medium term. From wave perspective, prices have completed (a-b-c) pattern in flat this can be wave a at one higher degree followed by wave b up or one correction is done and prices will resume the uptrend with wave iii higher. I am open with both possibility which suggests that prices will advance. In short 9000 is my support, as far as it is intact 13000 and above is what I am expecting.

Educational Video part 2: Double top and Retracement

Double top is a reversal pattern and Retracements helps to identify support and ressitance. Check out the criteria to identify a double top patter. Click on https://youtu.be/LO3wmOOPR34

Nifty Small Cap: Near support and a rally to follow

Image
Nifty Small Cap Nifty Small Cap is finding support near its previous low which indicates that the downtrend is not dynamic and prices are all set to move higher finding support from the lows. The important support of 5600 will be crucial. The second best support will be at 5900 levels.  As far as 5900 is intact prices can move up till 7100 levels. The level of 7100 will be achieved in a dynamic move as it will be in wave iii (impulse wave). This wave iii is likely to be an extended wave.  In short, Small Cap stocks are in focus as prices of an index can soar till 7100 with support of 5900 levels over medium term.

Nifty: Reversal on Cards?

Image
Nifty Daily Chart In my earlier update Nifty, I had mentioned that Nifty will continue the downtrend till 11400. However, this seems to now fade away as the index re-entered the falling red channel as shown in the chart. When prices re-enter the channel or a trend line, it possibly makes the bears short squeeze their position which results in a rally, taking prices higher. The index is also trading in a support zone of the exit poll gap (shown by two horizontal lines). As far as prices remain above 11450 levels it is possible that it can reverse the direction and move higher. As per Elliott Wave theory, prices might have completed wave c down at 11461 levels and has already started another leg up. This leg can go up till 11700-1800 levels. For this level to remain intact it is imperative that prices should not break 11450 (closing basis).

DLF: Triangle and Forecast

Image
DLF Daily Chart DLF is moving in a sideways pattern in the range of 170-200 levels. In the above chart I have drawn two trend lines joining the two tops and two bottoms, by doing that the two trend lines eventually converge making an apex. This pattern is called as a symmetrical triangle pattern. A triangle pattern can be a continuation pattern or a reversal pattern. In this case with help of advance technical analysis I have come out with a conclusion, that it will be a continuation pattern. Advance technical analysis i.e Elliott Wave indicates that a triangle normally forms in wave b or wave 4 or in a complex correction. After forming wave c at 140 levels, the stock rallied near till 205 levels and formed wave a thereafter it formed wave b in a triangle pattern. The next leg of wave c up is pending. In short, DLF will surge going ahead which can take prices near till 210 levels in near term with support at 175 levels.

Nifty Wedge Break: Anticipated Happened and forecast

Image
Nifty Anticipated on 7th July 2019 Nifty Happened on 8th July 2019 In my previous update on Nifty: Wedge Break I had mentioned that "  Nifty is in a bear grip and can witness selling pressure in coming week dragging prices lower till 11600 in near term." Nifty faltered more than 250 points in a single day and tanked below 11600- Anticipated Happened. For detail of the above analysis click on this link:- https://www.marketanalysiswithmeghmody.com/2019/07/nifty-wedge-break.html Nifty on the following day consolidated and made a candle which seems to be a reversal pattern i.e today on 9th July 2019. However, it is difficult to come to a conclusion that Nifty will reverse as it is important for a following day confirmation. If you want to catch a reversal, it is like catching a falling knife. The resistance will be at 11700 levels which is difficult to cross. On the downside 11400 will be a support as the index is on the brink to fill the exit poll gap. From W

GBPUSD: Impulse wave

Image
GBPUSD Daily chart GBPUSD is on the brink to tumble as it is moving in a lower high and lower low formation. This formation is a diabolic formation for the bulls. Any move in a rally is a selling opportunity. Once the selling intensifies at the supply zone the bears drag the prices and try to break the previous bottom which accelerates further selling pressure. As of now the falling blue channel is intact and so as its resistance and support. Prices are trading close to the resistance. From past five trading sessions prices are closing near the low of the day. The resistance for cable will be placed at 1.27 and on the downside it can move till 1.23-1.22 price range. As per wave theory, prices are moving in wave c which is a five wave structure. Here wave c is extended in wave iii which is a longest wave. This wave can stumble prices till 1.23 levels. In short, the bias is firmly negative for GBPUSD as prices are set to falter near till 1.23-1.22 leve

Nifty: Wedge break

Image
Nifty Daily chart Nifty last week witnessed heavy selling especially after the budget. Prices which were moving in a wedge pattern has finally given a negative break. It not only broke the boundary of the pattern but also closed near the low of the day which is negative sign. From retracement perspective, price rose more than 61.8% of the previous fall from 12100-11600 levels. This now can be termed as a flat pattern (Wave Theory) If wave a (12100-11600) was a three wave structure and wave b which is a three wave structure (w-x-y) then wave c will be five wave structure. This wave c can take prices near to the end of wave a which is close to 11600 levels. In short, Nifty is in a bear grip and can witness selling pressure in coming week dragging prices lower till 11600 in near term.

MCX Zinc: Corrective pattern to unfold

Image
MCX Zinc Daily Continuous chart MCX Zinc is moving precisely in a falling blue channel. Prices recently faced the resistance of the channel and reversed. It is also on the bring to break its previous low (marked by blue horizontal line). Any break below 194 will open further negative possibilities which can drag prices way lower, near o the support of the channel. From wave perspective, prices are moving in a corrective pattern (a-b-c) as of now. In which it has started wave c on the downside which can make price tumble till 185-182 levels. This wave c is impulse in nature and so the fall will be dynamic. In short, MCX Zinc is negatively poised and is set to falter close to 185-182 prices zone in near term. The resistance will 201, any move above this level will change the direction.

Educational Video part 1- Trendlines

This is an educational video on Trend lines which covers:- - How it is drawn? - Rules of drawing - Where to start i.e when market progresses and declines. - Other versions of trend lines etc... Check out the video here ↓