MCX Zinc: Corrective pattern to unfold
MCX Zinc Daily Continuous chart
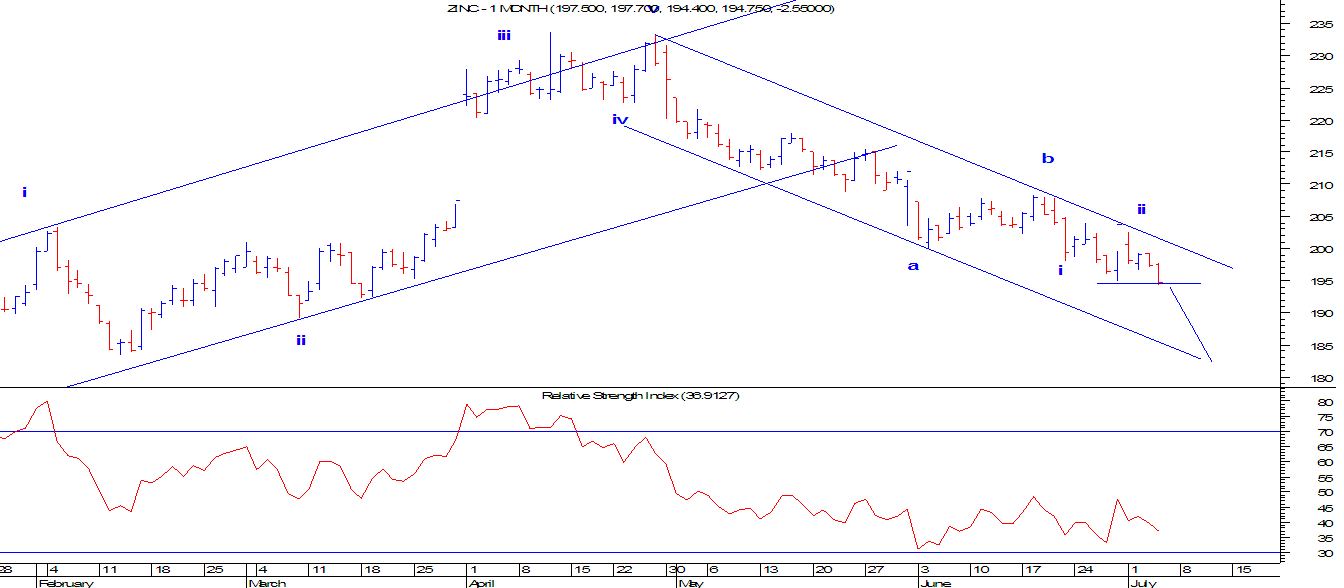
MCX Zinc is moving precisely in a falling blue channel. Prices recently faced the resistance of the channel and reversed. It is also on the bring to break its previous low (marked by blue horizontal line). Any break below 194 will open further negative possibilities which can drag prices way lower, near o the support of the channel.
From wave perspective, prices are moving in a corrective pattern (a-b-c) as of now. In which it has started wave c on the downside which can make price tumble till 185-182 levels. This wave c is impulse in nature and so the fall will be dynamic.
In short, MCX Zinc is negatively poised and is set to falter close to 185-182 prices zone in near term. The resistance will 201, any move above this level will change the direction.


Comments