Posts

Showing posts from May, 2023

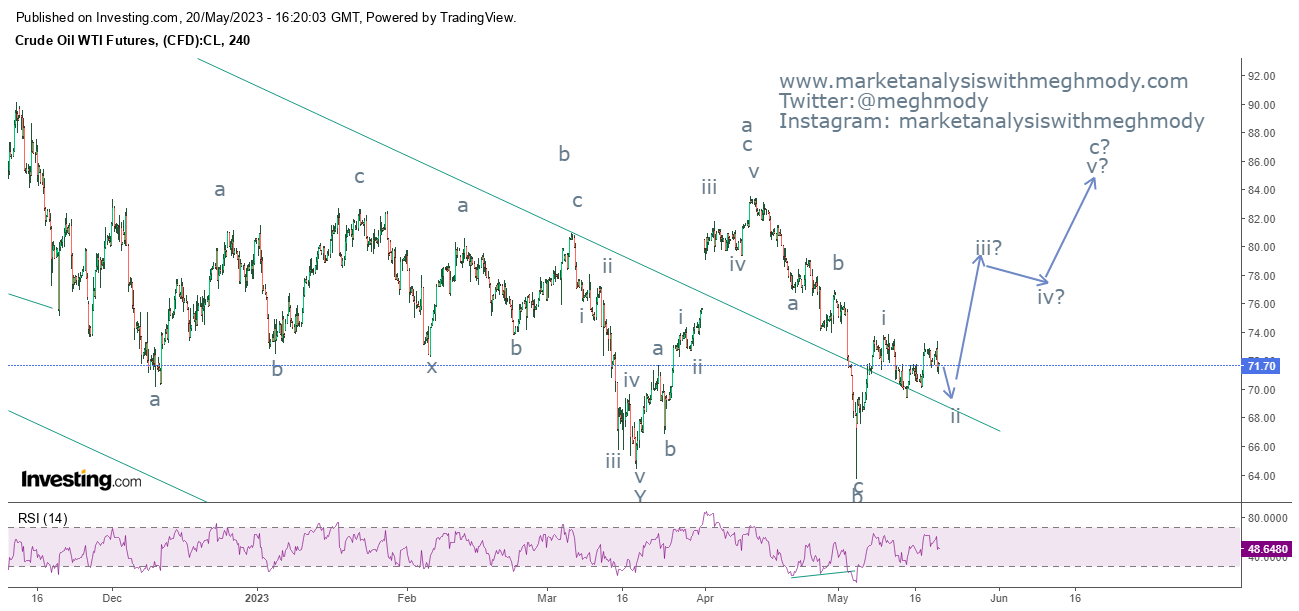
WTI Crude Oil- Wave iii to start?

Image
 WTI Crude Oil 4 hour chart Analysis As seen in the above chart, I was of the opinion that prices will move down and test the level of $69-68 levels but it seems that prices are not going to do that. Prices have completed the range bound move and has the probability of breaking the range on the higher side which can take prices higher. From Waves perspective, prices completed wave ii in the form of failure and there is high possibility that wave iii will be fast on the upside which can go towards $81.38 levels followed by $82.00 levels. The summation is WTI Crude Oil is positively poised and can move higher from current levels towards $81.38-82.00 levels over short term. Join my Telegram Channel :  https://t.me/elliottician1 Join My Twitter handle :  https://twitter.com/meghmody? s=11&t=LtKvFYlMyQs71k-udwEPgQ

Comex Gold

Image
 Come Gold 4 hour chart Analysis As seen in the above chart, prices broke the important support of $1950 which was crucial, but the yellow metal continues to remain near to it and has not gone down decisively gives us another indication that there can be another leg on the upside. This leg can cross its previous high or can fail as well. I think truncation or failure is possible. As EURUSD continues to tumble, Gold which moves in sync with it can move down from there as well. RSI is showing positive divergence and can take prices higher which can go till $2000-2040 levels over very short term. As per wave theory, prices are moving in expanding diagonal pattern and one more leg on the upside is pending which can take prices near to the above mentioned range. The summation is Comex Gold is expected to move towards $2000-2040 levels over short term. Join my Telegram Channel :  https://t.me/elliottician1 Join My Twitter handle :  https://twitter.com/meghmody? s=11&t=LtKvFYlMyQs71k-udwE

EURINR Elliott Wave Analysis

Image
 EURINR daily chart Analysis As seen in the above daily chart, prices are moving in a lower high lower low fashion after facing the resistance of its previous high (horizontal upper red trend line) and also the distribution pattern which was formed near to it known as expanding rising wedge pattern. Once price broke this pattern it started moving down and can falter going ahead. From waves perspective, prices are moving in a flat pattern (A-B-C) and offlately it has opened wave C on the lower side. Wave C is impulse in nature and currently it is moving in a wave iii which can go till 87.60-87.20 levels. Then a counter trend in the form of wave iv can come followed by wave  v of wave C which can test the range of 86.80-86.00 levels. The summation is EURINR is negatively poised and can slump towards 87.60-87.20 price range and over medium term it can test the range of 86.80-86.00. Join my Telegram Channel :  https://t.me/elliottician1 Join My Twitter handle :  https://twitter.com/meghmod

Nikkei 225 - Anticipated Happened and forecast

Image
 Nikkei daily chart anticipated on 6th May 2023 Nikkei daily chart happened on 23rd may 2023 Analysis In my previous update dated on 6th May 2023, I had mentioned that, " Nikkei 225 is positively poised and can soar till 31300-31500 levels over short to medium term." The index made a high of 31352 and has shown signs of reversal thereby achieving my level of 31300-31500 levels - Anticipated Happened To view my previous article on Nikkei 225 where I did this forecast, click on the below mentioned link https://www.marketanalysiswithmeghmody.com/2023/05/nikkei-225-3rd-wave.html As seen in the above chart, prices made a high of 31352 and formed a big red candle at the top. Thereafter it has started correcting which opens negative possibilities.  From waves perspective, prices are moving in a wave 4 after completing wave 3 at the top. This wave 4 can correct till 38.2% of wave 3 minimum which comes to 29550 levels. The summation is Nikkei 225 can correct towards 29550 levels over

Finnifty wave ii still in motion?

Image
 Finnifty daily chart Finnifty 2 hour chart Analysis From the above daily chart, prices are moving in big range of 19600 on the higher side and on the lower side 17200. As prices are near to the resistance of the range there are high chances that the index can reverse and prices can start moving down over medium term. Over short term there are high chances that the index will consolidate near to the resistance for some time. As seen in the 2 hour chart, the index is moving in a range of 19000 -19600 price range and can move higher from current levels to test the upper extreme. Also the index option analysis suggests that highest OI is built up at 19500 levels and on the downside 19300-19200 levels. So prices can move higher from here to test 19500-19600 levels and then falter for the next expiry and week. As per Wave theory, the index is moving in wave ii. After completing wave i at 19210, prices moved up where the subdivisions of the wave was expanded and currently prices are moving u

Bank Nifty Elliott Wave Analysis

Image
 Bank Nifty daily chart Bank Nifty 2 hour chart Analysis As seen in the above daily chart, Bank Nifty is moving in a higher highs and higher lows with RSI exhibiting negative divergence. This setup is a common setup especially when the asset class is in the last leg of the ongoing trend. Also this is a classic distribution pattern commonly known as rising wedge pattern. However, I am not able to figure out as of now whether prices have completed the pattern or it has just started. From 2 hour chart, the index is hovering near to its previous resistance level (horizontal red line) where it is trying to consolidate. As of now there are major CE sellers at 44000 levels followed by 44500 levels which is a clear indication that prices will continue to move in this range and reach towards this zone and then can again come back to test the lower extreme where 43700-43500  where PE sellers are placed. As per Wave theory, I think I was early to predict the ending diagonal pattern. I think price

Nifty and the Wave counts

Image
 Nifty daily chart Nifty 2 hour chart India VIX Analysis Nifty is moving in a lower highs and lower lows, though it went above its previous high last week and I went wrong in anticipating the fall. As market is now going to fall in impulse fashion I am of the opinion that market is likely to collapse but will be corrective in structure. As seen in the daily chart, prices are moving in a falling channel with RSI exhibiting negative divergence for the third time which is an indication of a caution. Also to understand the VIX chart, prices have arrived near to 12 years low the lower horizontal line, thereby opening a possibility of a reversal in prices coming soon. From 2 hour chart, the index is moving in a higher highs and higher lows in a falling channel (big) and also currently moving in an impulse fashion. However, there is a strong built up of CE sellers at 18600-18800 levels which will act as a resistance for now. Also there is a room for 100 points higher from here which can termi

Nifty and Elliott Wave Analysis

Image
 Nifty daily chart Nifty 2 hour chart Nifty OI for 25th May 2023 Analysis From above daily chart, prices which were moving precisely above the red trend line has broken it and closed below it from past three trading sessions thereby opening negative possibilities. The index made a low of 18,060 levels close to my mentioned level of 18,000 which was the mean and closed above 18200 levels. With negative divergence continues to form it is least likely that Nifty will close above 18300 at least till couple of months from here. As seen in the 2 hour chart, the index has discontinued the higher highs and higher lows and below the short term moving averages on a smaller time frame. The moving averages has also given a bearish crossover which indicates that the health of the index is ill. There is CE and PE sellers positioned at 18200 levels but most of the CE sellers are at 18300, 18400 levels. This data suggests that the index can dip going ahead towards 18000 and then till 17600 levels. Fro

Nifty Bank Ending Diagonal in making?

Image
 Nifty Bank daily chart Nifty Bank 2 hour chart Nifty Bank PCR  Analysis As seen in the above chart, prices are moving in a higher highs and higher lows and there is no sign of reversal. However, there is a possibility of a distribution pattern which is happening in this index which is the rising wedge pattern, where RSI is also exhibiting negative divergence. From 2 hour chart, a rising wedge is still in making and there is a possibility of a new high to happen where prices will surpass its previous high of 44,151 levels and make a new high. This will then open negative possibilities as RSI will then be making triple divergence. The PCR is above 1, currently at 1.13 indicating that the biasness is negative for the index as seen in the above intraday chart of PCR. According to Wave theory, prices are moving in wave B where it has completed wave a and wave b and currently moving in wave c which is a flat pattern as wave B has gone up till 100% of wave A. In wave wave v of  wave c of wav

FinNifty and Head and Shoulder Pattern

Image
 Fin Nifty daily chart Fin Nifty 2 hour chart Fin Nifty Option chain analysis as on 23rd May 2023 Analysis From the above daily chart, prices are facing the resistance at 19,600 levels where the red upper horizontal line is placed. There was an attempt to break this line but due to overhead supply it re-entered the horizontal line. As of now prices are above both the moving averages but not for long as this week there are high chances that prices will move below the averages. As seen in the above 2 hour chart, the index has formed a bearish head and shoulder pattern, the target of the pattern comes to 18800 levels. Also in both the above time frame, RSI is exhibiting negative divergence which is sign of caution. An option chain analysis is done For Fin Nifty as on 23rd May expiry, which is suggesting as there is CE sellers which are very much active at 19,500-19,600 levels and on the lower side there are PE sellers at 19,300-19,200 levels. This suggests that expiry will be within this

Dow Jones (DJIA): Reversal On Cards?

Image
 Dow Jones daily chart Analysis From the above chart, it is very clear that prices are moving in a sideways direction particularly in the range of 34,500-32,000 levels. The moving average has also whipsawed numerous times, indicating the trend is sideways. However, MACD which is shown in the lower panel is exhibiting negative signal suggesting that the index is on the brink to reverse or change the trend.  The index continues to move in a lower highs and lower lows fashion and it is moving in a falling channel. The recent up move has not discontinued the lower highs and lower lows. As per Wave theory, prices are moving in corrective fashion (A-B-C) or complex correction pattern (W-X-Y)  where wave A/W and wave B/X is over or on the verge to complete and wave C/Y will start which can drag prices towards 29,000-28500 price zone. The summation is Dow Jones is negatively poised and can falter towards 29,000-28,500 price zone over medium term. Join my Telegram Channel :  https://t.me/elliot

WTI Crude Oil and Elliott Wave Counts

Image
 WTI Crude Oil 4 hour  chart Analysis As seen in the above chart, prices are moving in a sideways direction particularly in the range of $74- $69. It is imperative for prices to break this range for a trending or directional move to emerge. As far as prices persists in the above mentioned range the bias will be sideways. Also to add here that prices have reversed from the resistance of the range and it is moving down which can drag prices to test the support of the lower extreme of the range. From Waves perspective, prices are moving in wave ii after completing wave 1 at $74 levels. In wave ii prices are moving in a flat pattern (a-b-c) where wave a and wave b is over and wave c on the downside will open which can falter prices near to $69.50-$69.00 levels. The summation is WTI Crude Oil prices are expected to drop till $69.50-$69.00 price range before resumption of the major trend. Join my Telegram Channel :  https://t.me/elliottician1 Join My Twitter handle :  https://twitter.com/meg

Comex Gold Anticipated Happened and Elliott Wave Analysis

Image
 Comex Gold 4 hour chart anticipated on 13th May 2023 Comex Gold 4 hour chart happened on 18th May 2023 Analysis In my previous update I had mentioned that, " Comex Gold can be bought near to the level of $1990-$1980 levels for the up side level of $2100-$2110 over short term. The support will be placed at $1950." The yellow metal plunge towards $1954 last week and closed near to $1980 levels (weekly closing). Thereby achieving my level of $1990-1980 on the downside. The upside target is still intact and it is now set to move higher - Anticipated Happened To view my previous article on Comex Gold, click on the below mentioned link https://www.marketanalysiswithmeghmody.com/2023/05/comex-gold.html From the above chart, prices found the support of $1950 and bounced from this level thereby suggesting that the uptrend is still intact. The metal looks to now move higher as it is moving in a distribution pattern. There is a high possibility that gold can again move back towards $20

USDINR: Will it cross 83.00?

Image
 USDINR daily chart anticipated on May 6th 2023 USDINR daily chart happened on May 19th 2023 Analysis In my previous update I had mentioned for USDINR, " USDINR is expected to open positive possibilities once the level of 82.15 is taken out on the upside which can propel price towards 83.00 over short term and then any move above 83.00 will surge it towards 84.50-85.00 levels. However, any break below 81.40-81.00 levels will negate the upside view." There were cluster of supports near 81.40-81.00 levels and from there the pair has reversed thereby breaking 82.15 levels and made a high close to 83.00 levels - Anticipated Happened To view my previous article on USDINR, click on the below mentioned link https://www.marketanalysiswithmeghmody.com/2023/05/usdinr-at-multiple-supports-and-elliott.html As seen in the above daily chart, the pair has arrived near cluster of resistances which is also the consolidation zone formed from past 6-7 months. If prices move above this level whi

FinNifty Elliott Wave Analysis

Image
 FinNifty daily chart FinNifty 2 hour chart Analysis As seen in the above daily chart, prices are consolidating near to the resistance of red horizontal line where its previous high is placed. The index also has started exhibiting negative divergence in RSI in longer and shorter time frame. The benchmark  has the upside capped or limited and has the potential to reverse the trend any time. Also the index is forming rising wedge pattern, just like in Nifty Bank. However, in both the cases it is in the initial stages of the formation. Once this pattern is completed, the index can slump to a greater degree. From 2 hour chart, prices are currently above both the short term moving averages but as it is moving in a rising wedge pattern and the upside is capped there are chances for some profit booking to take place which can drag price towards 19330-19290 price range.  According to Wave analysis, prices are moving in an ending diagonal pattern in wave v, within wave v it has recently complet

WTI Crude and Wave counts

Image
 WTI Crude Oil 4 hour chart Analysis From the above chart, WTI Crude Oil prices are moving lower after a sharp appreciation is prices till $74 levels. Prices are now down by almost $4 from its high and has closed above the falling trend line and taken support of 38.2% of the previous rise. At present it is near to the confluence zone and can shown signs of reversal in next week. However, a break below $70 will open the possibility of 50% which comes to $68.70 levels and a move above $71.80 levels will resume the uptrend. I have already mentioned that prices can test the level of $84-85 levels which will be my final target to capture the upmove. As per Wave theory, prices are moving in a counter wave which is wave ii. As of now it is difficult to say if wave ii is over or not, but it is near crucial support as mentioned above. Any move above $71.80 will open the possibility that wave ii is over and wave iii has started on the higher side. The summation is WTI Crude Oil prices is at pote