Posts

Showing posts from June, 2023

Bank Nifty Elliott Wave Analysis

Image
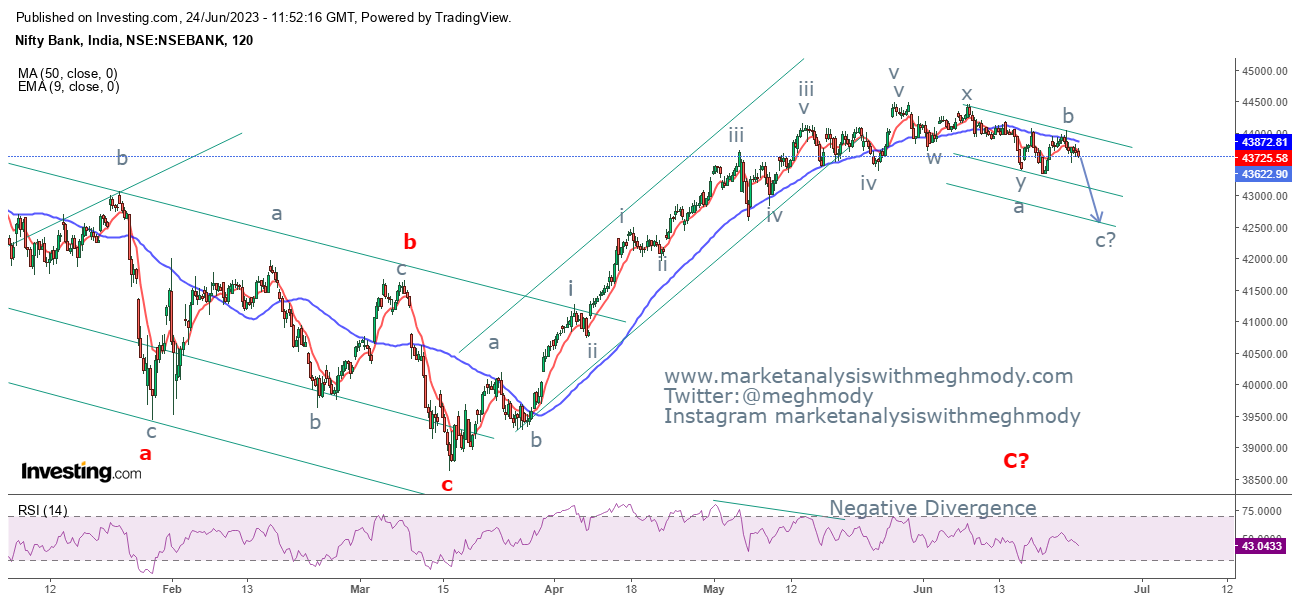
 Bank Nifty 2 hour chart Analysis As seen in the above chart, the index is moving in a sideways pattern after enormous possibilities applied in understanding the development in the index. However, the fall looks to be corrective rather than impulse. Also price have now come below both the moving averages thereby opening negative possibilities. As per Elliott Wave, prices have completed wave B on the higher side and has opened wave C on the lower side but it is corrective in nature so it can also be (WXY) pattern or a bigger triangle pattern.  The summation is Bank Nifty is negatively poised and can move down towards 43300 followed by 42600 levels. Join my Telegram Channel :  https://t.me/elliottician1 Join My Twitter handle :  https://twitter.com/meghmody? s=11&t=LtKvFYlMyQs71k-udwEPgQ

Nifty Elliott Wave Analysis

Image
 Nifty daily chart Nifty 2 hour chart Analysis In my previous update I had mentioned that, "  Nifty has still room to move higher and can test 18900-19100 price range going ahead. Also one needs to be cautious on the buying side as the index is arriving near to its previous swing high of 18886 levels." Nifty made a new high 18885.70 levels and I had also said that to be cautious as it will arrive to its previous swing high - Anticipated Happened. To read my previous update on Nifty, click on the below link https://www.marketanalysiswithmeghmody.com/2023/06/nifty-anticipated-happened.html As seen in the above daily chart, the index faced the resistance of its previous high which was placed at 18886 levels and witnessed selling pressure on the last trading day of the previous week. Also RSI which was exhibiting negative divergence was not able to pull prices lower, instead the price was moving in the north direction. However, prices have now formed a expanding diagonal off late

Ethereum wave iii of wave 3

Image
 ETH 4 hour chart Analysis As seen in the above chart, prices are moving in a positive formation with higher highs and higher lows. The bias remains positive as there is no discontinuation of the formation. Prices are expected to reach near to its previous high which is placed at $2100-$2200 levels. From Waves perspective, prices are moving in either wave iii of wave 3 or still moving in wave ii of wave 3. In both the cases there will be an attempt by the crypto to reach towards $2100. The summation is Ethereum can move towards $2100-$2200 over short term with positive bias. Join my Telegram Channel :  https://t.me/elliottician1 Join My Twitter handle :  https://twitter.com/meghmody? s=11&t=LtKvFYlMyQs71k-udwEPgQ

Dow Jones Wave C of Wave B

Image
 DJIA daily chart Analysis From the above chart, prices are moving in a falling channel and has been consolidating near to its previous high of 34600 levels thereby moving in a stiff range of 32600 on the downside and 34600 on the upside. As far as prices persist in this range the bias will be sideways. However, prices which are currently at the resistance can move down from current levels and reach towards 32600 or even can break it this time. MACD is negatively poised. As per Wave theory, the index completed wave b of wave b and is likely to start wave c on the lower side which can move till 32600 followed by 31500 levels. The summation is DJIA is likely to tumble towards 32600 followed by 31500 levels over short to medium term. Join my Telegram Channel :  https://t.me/elliottician1 Join My Twitter handle :  https://twitter.com/meghmody? s=11&t=LtKvFYlMyQs71k-udwEPgQ

Axis Bank Double top?

Image
 Axis bank daily chart Analysis The banking stock has arrived near to its previous high (marked with horizontal red line) and is now showing signs of reversal. This can also be termed as a double top pattern where prices can now show deep correction going ahead. MACD has also given a sell signal. Wave theory indicates that, prices which went up slightly above its previous high was wave B in making after completing wave a at 815 levels. This means wave c on the lower side can start and will eventually complete flat pattern (a-b-c). The summation is Axis Bank can tumble towards 910 levels over short term and over medium term it can move towards 850-820 levels. Join my Telegram Channel :  https://t.me/elliottician1 Join My Twitter handle :  https://twitter.com/meghmody? s=11&t=LtKvFYlMyQs71k-udwEPgQ

DLF - Five waves completed

Image
 DLF daily chart Analysis As seen in the above chart, prices which were moving in a higher highs and higher lows and have discontinued the positive formation, thereby opening negative possibilities. The stock has gone up till 508 levels but could not sustain higher and broke its previous swing low of 480 levels. It has also closed below the 20 EMA (red) moving average which has happened after March 2023. RSI has also exhibited negative divergence and has slumped towards the center line. From Waves perspective, prices are moving in a five wave structure which has completed where wave v was formed in ending diagonal pattern. After that the pattern was broken and started moving in a falling channel. Prices are moving in a corrective structure mainly wave a which can find support near to 465-460 levels. The summation is DLF is expected to falter towards 465-460 price range over short term. Join my Telegram Channel :  https://t.me/elliottician1 Join My Twitter handle :  https://twitter.com/

MCX Copper Wave 2 to stay

Image
 MCX Copper daily chart Analysis As seen in the above chart, prices are moving in a lower highs and lower lows fashion, especially after making a high of 804 levels. MACD which is below the center line has exhibited fresh sell signal, indicating that the bias is negative.  According to Wave theory, prices are moving in wave ii in which it is moving in wave c where wave i and wave ii is over and wave iii has started which can tumble towards 675-670 levels. The summation is MCX Copper is negatively poised and can falter towards 675-670 price zone over short term. Join my Telegram Channel :  https://t.me/elliottician1 Join My Twitter handle :  https://twitter.com/meghmody? s=11&t=LtKvFYlMyQs71k-udwEPgQ

EURINR Wave B in motion

Image
 EURINR daily chart Analysis EURINR is moving in a sideways direction with not clear trend. The sideways action has a broad range with support placed at 86.00 and resistance at 91.00 levels. Off lately prices have bounced from the level of 88.00 and has climbed back above 90.00 levels last week. The closing was below 90.00 but it seems that prices will re-conquer 90.00 levels in coming week. From Waves perspective, the pair is moving in wave B where wave A has taken 24 trading sessions and wave B has taken more than that, this confirms that prices are moving in a flat pattern (a-b-c). Currently prices are moving in wave B in which it is moving in wave c which is impulse. In wave c it has completed wave iii and wave iv which is still going on or is over. If it is completed than wave v on the higher side will start which can take prices near to 90.50 levels. The summation is EURINR has a significant support at 88.70, as far as it is protected on the downside, prices are expected to move

Nifty - Anticipated Happened

Image
 Nifty 4 hour chart anticipated on 10th June 2023 Nifty 4 hour chart happened on 16th June 2023 Analysis In my previous update I had mentioned that, " Nifty is positively poised and can move higher towards 18800-19100 levels over short to medium term." The benchmark made a high of 18863 levels which was anticipated range and it has not only crossed this but closed within the above mentioned range - Anticipated Happened. To view my previous update, click on the below mentioned link https://www.marketanalysiswithmeghmody.com/2023/06/nifty-and-5th-wave-extended.html As seen in the above chart, prices are moving in a higher highs and higher lows and in the wave v of wave v there is still room as five waves internally are not clear. This means that the uptrend will continue and prices will nearly reach towards 19100 levels which is the second resistance zone as per the Fibonacci projection. The summation is Nifty has still room to move higher and can test 18900-19100 price range g

Bank Nifty - Consolidation to persists

Image
 Bank Nifty 2 hour chart Analysis As seen in the above chart, I was of the opinion that the index can be forming expanding diagonal pattern but it seems that this will not be the case. The index is likely to take more time and consolidate in the range of 43400 on the lower side and 44200 on the higher side. The other possibility which I am opening here is that, as prices are moving in wave B there are high chances for the index to form triangle pattern at the top which will take time as it has completed wave a, wave b and currently moving higher in the form of wave c which can go till 44200-44300 price range. The summation is Bank Nifty can go higher from current levels but there can be dips coming in between which can drag prices near to 43700-43600 levels and then the index can soar towards 44200-44300 price zone. Join my Telegram Channel :  https://t.me/elliottician1 Join My Twitter handle :  https://twitter.com/meghmody? s=11&t=LtKvFYlMyQs71k-udwEPgQ

Gail Wave C to start?

Image
 GAIL daily chart Analysis As seen in the above chart, prices are moving in a sideways direction with the upper and the lower extremes well defined. On the higher side the stock has the cap placed at 114 levels and on the lower side the stock has support placed at 85 levels. Recently the stock has arrived near to the resistance and has reversed its trend facing the overhead supply, thereby opening negative possibilities. According to Wave theory, the stock has subdivisions and completed wave a at 83.50 levels followed by wave b in a flat pattern and has started wave c lower where wave i of wave c is over and currently it is moving in wave ii of wave c where it can reach near to 110-111 levels and then falter towards 95 levels in the form of wave iii. The summation is GAIL can be sold near to 110-111 levels as it can falter towards 95-98 price zone over short term. Join my Telegram Channel :  https://t.me/elliottician1 Join My Twitter handle :  https://twitter.com/meghmody? s=11&t=L

ICICI Bank Complex Correction

Image
 ICICI Bank 4 hour chart Analysis As seen in the above chart, prices were consolidating in a descending triangle pattern which was broken on the lower side thereby giving a bearish breakout. Prices then tried to move higher and re-test the pattern trend line but not closed within the pattern. MACD is exhibiting sell signal and it is also below the center line. From Waves perspective, the banking stock is moving in a complex correction where it completed wave W at 797 levels followed by wave X at 959 levels and wave Z is in motion where the first correction has started in which wave a and wave b is over and wave c on the downside is pending which can drag prices near to 920 levels followed by 910. The summation is ICICI bank is negatively poised and can move down near to 920 levels followed by 910 over short term. Join my Telegram Channel :  https://t.me/elliottician1 Join My Twitter handle :  https://twitter.com/meghmody? s=11&t=LtKvFYlMyQs71k-udwEPgQ

Shanghai Composite Index (SCI)

Image
 Shanghai Composite Index daily chart Analysis From the above daily chart, prices are moving in a sideways direction with no trending or directional move. However, the extremes of the range are well defined which is the upper and lower trend line and looks to be that the index is forming a bigger triangle pattern. As per Wave theory, prices might be moving in a symmetrical triangle pattern where it has completed wave c and it is currently moving in wave d where wave a and wave b of wave d is over and wave c of wave d is in motion which can move towards 3500-3550 levels over short term. The summation is Shanghai Composite Index can test 3500-3550 levels over short term as it is positively poised. Join my Telegram Channel :  https://t.me/elliottician1 Join My Twitter handle :  https://twitter.com/meghmody? s=11&t=LtKvFYlMyQs71k-udwEPgQ

Silver and Elliott Wave Analysis

Image
Comex Silver daily chart Analysis As seen in the above chart, prices after making a high of $26.46 levels have started showing signs of correction. The bullion seems to have made a top and can correct. However, the counter correction can also extend for some time. This is the similar case of counter correction where prices are expected to move higher from current levels towards $24.60-$25.00 levels. From Waves perspective, prices are moving in a counter correction which is wave b where wave a is over and wave b is in motion, within wave b prices have completed wave a and wave b and wave c of wave b is still pending which can test the above mentioned level. The summation is Comex Silver is positively poised and can move higher towards $24.60-$25.00 levels going ahead. Join my Telegram Channel :  https://t.me/elliottician1 Join My Twitter handle :  https://twitter.com/meghmody? s=11&t=LtKvFYlMyQs71k-udwEPgQ

Bitcoin: On the brink to give a breakout?

Image
 Bitcoin daily chart Analysis In my previous update I had mentioned that, " Bitcoin has a crucial support near to $25500-$25400 levels. Any bounce from these levels will soar price towards $27300 levels. Break above $27500 will then open further positive possibilities." The crypto bounced near to the support levels and made a high of 26789, there are high chances that it will achieve the level of $27300. But for further positive possibilities to open it is important that $27500 is taken out. To read the previous update on Bitcoin, click on the below mentioned link https://www.marketanalysiswithmeghmody.com/2023/06/bitcoin-in-ending-diagonal-pattern.html Prices are still moving in an ending diagonal and it is in wave v of wave c of wave ii. Once this leg is over and a break above $27500 is established, then there is a high possibility for the crypto to cross $33000 levels going ahead. The summation is Bitcoin needs to move above $27500 to open further positive possibilities wh

GBPINR: Expanding diagonal

Image
 GBPINR daily chart Analysis As seen in the above chart, prices are moving in a higher highs and higher lows. However, after crossing 100.00 levels, the pair was moving in a very slow pace giving an indication that distribution pattern is on the way. Daily RSI has arrived near to the overbought terrain. From Waves perspective, prices are moving in wave 5 where it has formed expanding diagonal which has five legs within. It seems that the 5 legs are done where the last leg was more like a zigzag and there are high chances for the pair to reverse and can test the lower trend line placed at 102.00 levels. The summation is GBPINR has a limited upside and can move down from the zone of 105.00-105.70 levels and can test the level of 102.00 over short term. Join my Telegram Channel :  https://t.me/elliottician1 Join My Twitter handle :  https://twitter.com/meghmody? s=11&t=LtKvFYlMyQs71k-udwEPgQ

Nifty and 5th Wave extended

Image
 Nifty 4 hour chart Analysis As seen in the above chart, prices are moving in a higher highs and higher lows and it is well above both the moving averages suggesting that the trend is positive. RSI continues to exhibit negative divergence but prices continues to make new high. As per Wave theory, there is an important development which has happened that can possibly completed wave B of one higher degree for which it has to make a new high. Currently prices are moving in an impulsive fashion which is wave c of wave B and has to cross its preceding high of 18810 levels that will complete wave B and then it will open wave C lower. Initially the upmove was challenging but now it looks to be solved as wave v of wave c is extended. In wave v wave i and wave iii are equal and wave v of wave v can be equal or can be extended. If it is equal then the index can move higher towards 19100 levels. But if it only goes till 38.2% then it can come near till 18810 levels. In both the cases prices are e

Bank Nifty and Diagonal

Image
 Bank Nifty 4 hour chart Analysis As seen in the above chart, the index is moving in a higher highs and higher lows with negative divergence in RSI which still persists. I think either it is moving in expanding diagonal or in ending diagonal or any other corrective pattern. I believe that the first two possibilities exists here. However, there is no reversal in the index and I think there is a possibility for the index to move higher towards new high placed at 44600-44800 levels. From Waves perspective, prices are moving in a diagonal as expected and there is a high possibility of wave iv to be over on last trading day of the week. As prices are above the 50 SMA (blue) the bias remains positive for the index, which can take prices to the new highs. The summation is Bank Nifty has high chances to reach near till 44600-44800 price range in coming weeks. The bias remains positive. Join my Telegram Channel :  https://t.me/elliottician1 Join My Twitter handle :  https://twitter.com/meghmody

Ambuja Cements wave 3?

Image
 Ambuja Cements daily chart Analysis From the above chart, prices are positively poised as it is making a higher highs and higher lows. Currently the stock is near to 455 levels and can move higher going ahead. Price ROC which is placed at the lower panel is in the positive terrain and also supports the positive momentum for the stock. As per Wave analysis, the stock is either moving in an impulsive fashion or in a corrective pattern in both the scenarios the bias remains positive and can reach towards 161.8% of the wave i and wave ii placed at 490-495 price zone. The summation is, the bias for Ambuja Cements remains positive as the stock has enough vacuum to reach towards 490-495 levels over short to medium term. Join my Telegram Channel :  https://t.me/elliottician1 Join My Twitter handle :  https://twitter.com/meghmody? s=11&t=LtKvFYlMyQs71k-udwEPgQ

SBI Wave 2

Image
 SBI 2 hour chart Analysis As seen in the above chart, the banking stock is moving in a positive direction with minor dips in a row. The stock as of now is positively poised and can move higher from current levels going ahead. However, the momentum in the stock is fading as compared to what it was from the lows. I am of the opinion that it can eventually form an rising wedge pattern. From Waves perspective, the stock is moving in a corrective pattern where it completed wave a and wave b and now it is moving in wave c where wave i and wave ii is over and wave iii will resume which can take prices near to its previous swing high. The summation is SBI can make an attempt towards 596-600 levels over short term. Join my Telegram Channel :  https://t.me/elliottician1 Join My Twitter handle :  https://twitter.com/meghmody? s=11&t=LtKvFYlMyQs71k-udwEPgQ

USDINR Wave 5 in motion?

Image
 USDINR daily chart Analysis For USDINR I am very affirmative that the pair is likely to breach 83.00 where cluster of resistances are placed. Over past 8 months prices are moving in a ascending triangle pattern and it seems that the triangle pattern is completed and prices are likely to move above 83.00 levels. However, it seems that the pair is taking its own time and continues to now trade above 82.00 levels, particularly in the range of 82.80-82.25 levels. As per Wave theory, prices have completed wave 4 in ascending triangle pattern and it has now opened wave 5, in which wave i is completed at 82.85 levels and wave ii of wave 5 is in motion which can terminate near to 82.20 levels. The summation USDINR has a crucial support placed at 82.30-82.20 levels where the pair can reverse and then can break 83.00 in this attempt. Join my Telegram Channel :  https://t.me/elliottician1 Join My Twitter handle :  https://twitter.com/meghmody? s=11&t=LtKvFYlMyQs71k-udwEPgQ

Taiwan Weighted Anticipated Happened

Image
 Taiwan Weighted daily chart anticipated on 7th April 2023 Taiwan Weighted daily chart happened on 26th May 2023 Analysis In my previous update dated on 7th April 2023, I had mentioned that, " Taiwan Weighted is expected to test 16,400 levels from current levels over short term." The index made a high of 16,400 levels after consolidating for almost a month and eventually achieving my level - Anticipated Happened To red my previous article on Taiwan Weighted and how I forecasted the price movement, please click on the below link https://www.marketanalysiswithmeghmody.com/2023/04/taiwan-weighted-elliott-wave-counts.html Prices are moving in wave iii in which it is very clear that wave iii is extended. Currently prices are moving in wave iii which is 100% of wave i. As of now there is no reversal and wave iii can also go near to 161.8%, but if it reverses then there can be a sharp correction as wave ii was sideways (alteration). The index an retrace till 50-61.8% of wave iii to

Bitcoin in ending diagonal pattern

Image
 Bitcoin daily chart Analysis From the above chart, prices are well above the bullish head and shoulder pattern. Recently, the crypto has come down to test the neckline of the pattern and there it has formed a falling wedge pattern which has the possibility of giving bullish breakout.  As per Wave theory, prices are moving in wave ii where it is currently moving in wave c of wave ii in which it is forming ending diagonal pattern. Completion of this pattern will indicate that wave ii is over and wave iii on the higher side has started. The summation is Bitcoin has a crucial support near to $25500-$25400 levels. Any bounce from these levels will soar price towards $27300 levels. Break above $27500 will then open further positive possibilities. Join my Telegram Channel :  https://t.me/elliottician1 Join My Twitter handle :  https://twitter.com/meghmody? s=11&t=LtKvFYlMyQs71k-udwEPgQ

MCX Aluminum Wave C to start?

Image
 MCX Aluminum 4 hour chart Analysis As seen in the above chart, prices found support at 78.6% of the previous rise from (210.40-215.20). It seems there are cluster of supports placed and the trend line which is supporting at the lower levels is tilted on the upside. RSI which was near to the oversold terrain when the price marked the recent low has reversed indicating that a pull back is on the cards. From Waves perspective, prices faltered in a corrective fashion (a-b-c) where wave b was a triangle and wave c was 61.8% from wave a to wave b. This indicates that once corrective wave is over and another leg on the upside has unfolded. I think wave b on the lower side is over and wave c which will be impulse in nature will start. The summation is MCX Aluminum has high chance to move higher towards 214.00-215.00 levels with support at 203.00 levels. Join my Telegram Channel :  https://t.me/elliottician1 Join My Twitter handle :  https://twitter.com/meghmody? s=11&t=LtKvFYlMyQs71k-udwE