Axis Bank Double top?
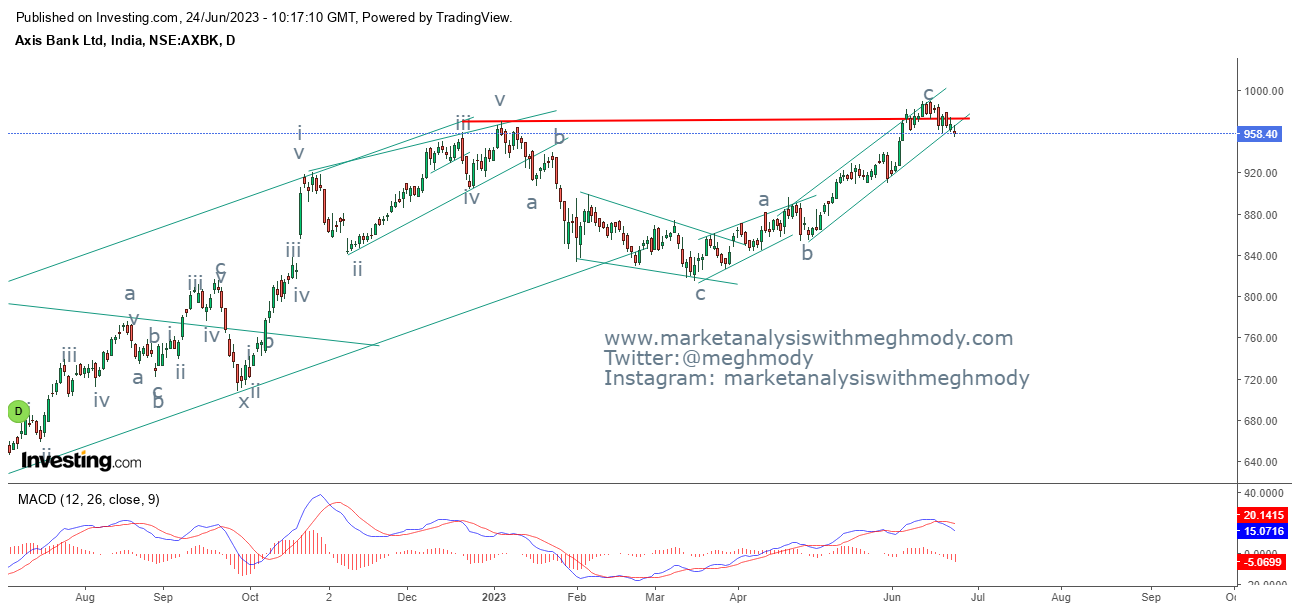
Axis bank daily chart
Analysis
The banking stock has arrived near to its previous high (marked with horizontal red line) and is now showing signs of reversal. This can also be termed as a double top pattern where prices can now show deep correction going ahead. MACD has also given a sell signal.
Wave theory indicates that, prices which went up slightly above its previous high was wave B in making after completing wave a at 815 levels. This means wave c on the lower side can start and will eventually complete flat pattern (a-b-c).
The summation is Axis Bank can tumble towards 910 levels over short term and over medium term it can move towards 850-820 levels.
Join my Telegram Channel : https://t.me/elliottician1
Join My Twitter handle : https://twitter.com/meghmody?


Comments