Posts

Showing posts from February, 2023

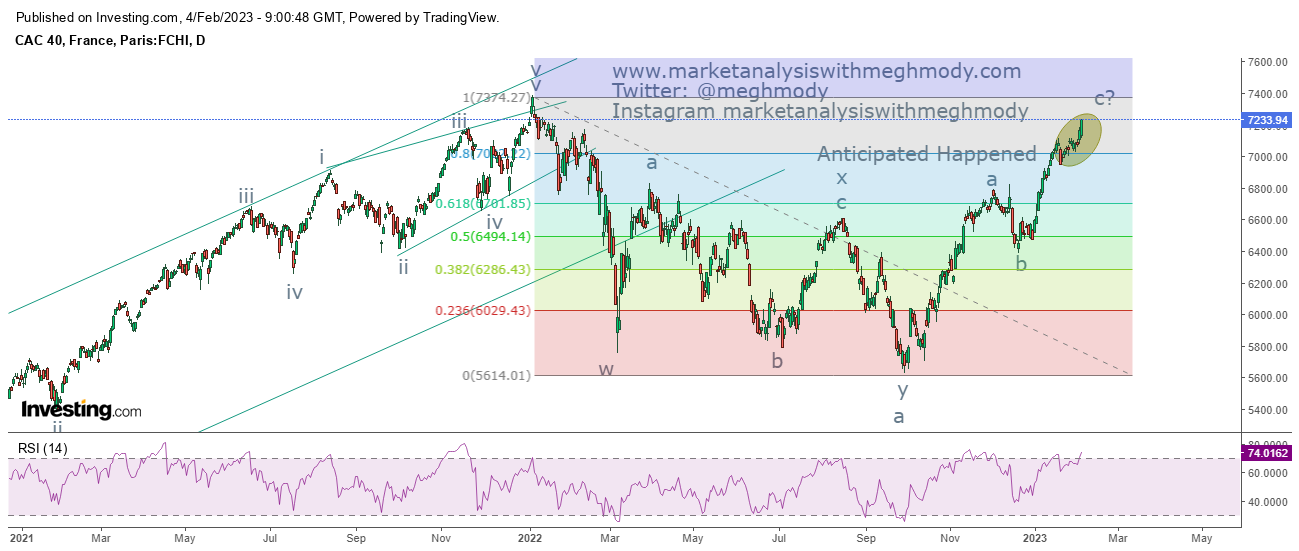
Nikkei 225 Anticipated Happened

Image
 Nikkei 225 daily chart Analysis From the above chart, as expected prices completed the diamond pattern and has started moving higher. I had predicted this rise in the month of January 9th and covered it in the report as well. You can view the excerpt from the report by clicking on the link https://www. marketanalysiswithmeghmody. com/2023/01/nikkei-neo-wave- diametric-revisited.html As per wave theory, prices completed Neo wave diametric pattern and has started fresh leg on the upside which is impulse in nature but on higher degree it will be a zigzag where it will complete wave a followed by wave b and then wave c higher. In ongoing wave a, there are five legs where wave 5 is in motion which can go above 28000 in near term. The summation is Nikkei 225 is set to move higher as expected and can move above 28000 levels over short term.

GBPINR: Symmetrical Triangle in making

Image
 GBPINR 4hour chart (spot) Analysis As seen in the above chart, prices are moving in a stiff range of 102-98 levels and as when time moves on the range becomes narrower thereby opening the possibility of a triangle pattern (symmetrical). For prices to give a breakout, it is important that it happens before 40% from the apex of the triangle. In the above case there is ample of time for that. Currently prices are near to the lower range of the triangle pattern and can move higher from current levels to test 101-101.50 levels over short term. RSI and Stochastic both are near to the oversold terrain and it seems that there is a high possibility for prices to move higher from current levels.  From Waves perspective, the pair is moving in wave 4 in which it is making a symmetrical triangle pattern (a-b-c-d-e) where it is currently moving in wave d where wave c is pending on the upside. Once wave d is over wave e on the lower side will start. The summation is GBPINR is set to move higher towa

Bank Nifty Update

Image
 Bank Nifty daily chart Bank Nifty 2 hour chart Analysis As shown in the above daily chart, prices continue to face the resistance of 41600 levels where it was first taking support. At present, just like Nifty it is forming a rising wedge pattern which once complete will open negative possibilities. Please understand prices are in a downtrend as the rising channel pattern is broken thereby opening negative possibilities. ADX is also not picking up indicating that the recent upmove is weak. From 120 mins chart, prices are moving in a very narrow range. So I have applied Bollinger Bands which also shows that it is narrowing and there is a high possibility for the breakout to emerge, which is above or below the bands. MACD is trend less as there is no clear signal maintained by the oscillator. As per Elliott Wave theory, prices are moving in wave ii of wave c where wave c is still in making. It looks  to be ending diagonal pattern in wave c and once it is complete and prices break below 4

Nifty Update

Image
 Nifty daily chart Nifty 2 hour chart Analysis As seen in the above daily chart, prices continues to be moving in a stiff range of 17700-17900 and consolidating near to the resistance of the falling trend line. There are also multiple of resistances placed at these levels where 20 EMA (red) and 50 SMA (blue) is placed. I will continue to hold my downside levels as mentioned in my previous update with resistances placed at 18100 levels. RSI has also relieved from the oversold terrain giving room to the downside levels. To read my previous article on Nifty, click on the below mentioned link https://www.marketanalysiswithmeghmody.com/2023/02/nifty-elliott-wave-analysis.html From 2 hourly chart, the index seems to be forming a rising wedge pattern (marked in red lines). Rising wedge has the potential to give a downside breakout but it seems that there is still a minor upmove left for the index. RSI is going up without a positive divergence. As per Wave theory, Nifty is moving down in an im

Bitcoin Elliott Wave Analysis

Image
 Bitcoin 240 mins chart Analysis From the above chart, prices could not move above $24000 which lead the price to tumble below $22000. It is very clear that the crypto is falling in a counter move, this means that it will face a Fibonacci number for the support. As per Wave theory, prices are moving in wave ii and can take support near to wave iv of wave i where the lower horizontal line is placed. In short, prices are likely to remain or consolidate in a range of $24000-$20000 for some time which will complete wave ii and eventually wave iii on the higher side will unfold. The summation is BTC will continue to remain in a range of $24000-$20000 for some time after that prices will pickup momentum and reach towards $33300-$33400 price range (minimum).  

Ethereum Anticipated Happened

Image
 Ethereum 240 mins chart anticipated on 4th Feb 2023 Ethereum 240 mins chart happened on 10th Feb 2023 Analysis Last week I had mentioned for ETH that, "  if Ethereum falters towards $1500 it can be utilized as a buying opportunity. Any move above $1680 will continue to uptrend" ETH was meant to buy at $1500 or near to it was because wave ii was unfolding, I had captured successfully the entire fall from $1640 levels - Anticipated Happened. To read my previous article on ETH, click on the below mentioned link https://www.marketanalysiswithmeghmody.com/2023/02/ethereum-wave-2-opening.html As seen from the above chart, prices failed to move above the red horizontal line and as a result it tumbled and arrived near to its previous low. It will be important to see if there is a sharp reversal coming for this crypto, if so then an intermediate bottom is at place and then there are high chances for prices to transcend its previous high and make a new one. As per wave theory, prices

Hang Seng - Elliott Wave Analysis

Image
 Hang Seng daily chart Analysis As shown in the above chart, prices which were moving in a falling channel has closed above it thereby giving bullish break. Along with that, the index was sustaining well above it. Hang Seng after making a high of 22760, has started falling and arrived near to the support of the falling channel (earlier resistance). RSI has also turned negative. From Waves perspective, the index is moving in wave ii and it seems that wave i is extended, this means that wave ii is unlikely to go below 38.2% from the bottom till 22760 levels. Again this is a guideline and not a rule. The level of support comes to 19600 levels (38.2%). The summation is Hang Seng is unlikely to go below 19600 and can consolidate in the range of 22760-19600 levels over the time.

MCX Natural Gas Elliott Wave Analysis

Image
 MC Natural Gas 240 mins chart Analysis As seen in the above chart, prices are moving in a lower highs and lower lows which is a negative setup. Off lately, prices have managed to break the falling red channel which gives a positive sign. Along with that RSI has started exhibiting positive divergence which opens the possibility that downside is capped. Wave theory suggests, prices have possibly completed wave c in which wave iii was extended. Currently prices have moved higher but it is important to see if it sustains above 195 levels. If it does then there are high chances that prices will move towards 260-270 price range in the form of wave i. If not then it is wave iv and wave v lower will unfold. The summation is as far as 195 is intact on the downside there are high chances that MCX Natural Gas will surge towards 260-270 price range. If it fails to protect the above mentioned level then it can move towards 179 levels.

USDINR: Anticipated Happened and Elliott Wave Analysis

Image
 USDINR 240 mins chart Analysis In my previous article I had mentioned that USDINR can move towards 82.80 when it was quoting at 82.16. On 6th February, the pair achieved my mentioned level - Anticipated Happened To read my previous article on USDINR, click on the below mentioned link https://www.marketanalysiswithmeghmody.com/2023/02/usdinr-towards-8280.html As shown in the above chart, prices are moving in a symmetrical triangle pattern. Recently when it came to test the higher side of the pattern it faced the resistance of 82.80-82.90 levels. From this supply zone it started moving lower and made a low of 82.32 but closed well above 82.50 levels. It is very evident that it will continue to fall from current levels as RSI is below the center line. Along with that, Wave theory suggests that prices have completed wave d at 89.90 levels and it has opened wave e which is the last leg of the triangle (a-b-c-d-e). This ongoing down leg can move down towards 81.80-81.60 levels where 50% fal

Nifty Bank Elliott Wave Analysis

Image
 Nifty Bank Daily chart Nifty Bank 2 hour chart Analysis As shown in the daily chart, prices are moving down in a lower high and lower low fashion which is a negative formation. Also it is important to observe that the index which was finding the support of 41700 levels (horizontal red line) once breached is now acting as a resistance (role reversal). Prices closed just below this horizontal trend line last week. From 2 hour chart, prices  have broken crucial supports there by opening negative possibilities for the index. The index is set to plunge towards the level 35600-35400 price range. As per wave theory, prices are moving in a corrective structure and can slump ahead as it has opened wave c on the lower side in which it has completed or might have wave ii and now it will open wave iii lower. The summation is Nifty Bank can tank towards 35600-35400 levels over short term. However, if the index moves above 42700 will negate the downside target and the view. 

Nifty Elliott Wave Analysis

Image
 Nifty daily chart Nifty 2 hour chart Analysis As seen in the daily chart, prices are moving in a lower high and lower low formation which is a negative sign. Also the short term moving average is negatively poised and it is now acting as a crucial resistance. After the Budget 2023-24, prices have come up and closed below the short term moving average 20 EMA (red). The moving average is now suggesting that the trend for the index is negative. Along with that RSI is also relieving from the oversold terrain. From 2 hour chart, the index here to is facing the resistance of the moving averages of 50 SMA periods which is an indication that the bias is firmly negative not only on 2 hour chart but also on daily chart. As far as prices persists in the falling channel, the bias is negative for the index. Wave theory suggests that, prices have opened wave iii lower of wave C of one higher degree. In this wave iii, it is extended where it has completed wave i and wave ii of wave iii and now it ha

CAC 40: Revisited

Image
 CAC40 daily chart Analysis In my previous report I had mentioned that, "  CAC40 can move towards 7200-7250 levels from current levels over very short term." CAC40 which was trading sub 7000 when I wrote this article is now trading at 7233 levels - Anticipated Happened. To read my previous article on CAC40, click on the below mentioned link https://www.marketanalysiswithmeghmody.com/2023/01/cac40-elliott-wave-analysis.html The index is moving near to its previous all time high placed at 7380 levels. It is difficult to come to a conclusion that if it can test this level or not. So I am now cautiously positive for this index and can reverse anytime soon.  As per Wave theory, prices are currently moving in wave B which is on the brink to complete and when it does prices will open in wave C which can drag prices towards 5600 levels. The summation is CAC40 can turn down anytime soon which will open doors for 5600 on the downside.

Ethereum Wave 2 opening

Image
 Ethereum 4 hour chart Analysis Ethereum has arrived near crucial resistance which is placed at $1680 levels. It is important for prices to breach this level to open further positive possibilities. Failure to do so will open counter move which can drag prices towards its pivot support. RSI has also started exhibiting negative divergence giving an indication that the upside is capped as of now. As per wave theory, prices are moving in impulse fashion where in it has completed wave i and wave ii is ongoing which can drag prices lower towards $1500 levels thereby completing wave ii and then wave iii higher will open. The summation is if Ethereum falters towards $1500 it can be utilized as a buying opportunity. Any move above $1680 will continue to uptrend.

Bitcoin a new trend starts?

Image
 Bitcoin daily chart Analysis After giving a fresh break in falling wedge pattern, prices continues to soar thereby climbing towards its previous high. It is very clear that the pace of prices to move higher is greater than the entire falling wedge. It is now important to see if prices crosses and sustains above $24000 which will continue the uptrend. If not, counter move is about to begin. RSI which is in overbought terrain can relieve from it just to make vacuum. From Waves perspective, prices are moving in an impulse fashion and possibly completed wave i, this will open wave ii lower which can remain in the range of $24000-$22000. The summation is Bitcoin needs to sustain above $24000 to open further positive possibilities which can surge prices towards $25400 levels. Failure to sustain above $24000 will consolidate in the range of $24000-$22000 levels.

MCX Zinc Elliott Wave Analysis

Image
 MCX Zinc hourly chart Analysis MCX Zinc has been moving in a stealth uptrend, off lately it has shown signs of reversal. It broke the rising channel formation along with the rising wedge formation and dipped towards 280 levels. It is so important to see that it has taken a perfect support of the gap (shaded). Currently prices are moving in a falling channel and has arrived near to the falling channel support along with gap support, thus opening the possibility of a bounce back. As per wave theory, after completing wave c in which wave v was an ending diagonal and after that prices faltered in wave a-b-c which will now open wave x higher towards 288-289 levels. The summation is MCX Zinc can shown a resilience towards 288-289 levels.

EURINR Revisited

Image
 EURINR 4 hour chart  Analysis In my previous article I had mentioned that, "  EURINR will continue to move higher with support of 87.40 (closing basis) and on the upside it can test the price range of 89.50-89.90 levels." The pair made a high of 90.50 levels thereby completing wave v in ending diagonal pattern achieving my mentioned level of  89.50-89.90 levels - Anticipated Happened. To view my previous article of EURINR, click on the below mentioned link https://www.marketanalysiswithmeghmody.com/2023/01/eurinr-5th-wave-starts.html Also you can see my previous article of how I captured the top of EURUSD https://www.marketanalysiswithmeghmody.com/2023/01/eurusd-revisited.html EURINR has shown reversal from the top as it gave up all the gains it made climbing above 90.4 levels and in two trading days it closed below 89 levels. Prices which were moving in a rising wedge pattern has not only given an overthrow, but has broken the wedge pattern from the lower side thereby openi

USDINR towards 82.80

Image
 USDINR hourly chart Analysis USDINR is moving in a higher highs and higher lows and it is moving precisely in a rising channel. As far as prices persists in this channel the bias remains positive for the pair. As per Elliott Wave, prices have opened wave d on the higher side in which it has opened wave c which can soar prices towards 82.80 levels going ahead. The summation is USDINR is set to move higher near to 82.70-82.80 price range over short term.

GBPUSD Triangle formation

Image
 GBPUSD hourly chart Analysis GBPUSD is on the brink to complete triangle pattern in wave B which will open wave c lower and the nature of this wave is impulse. There is a high possibility that prices will plunge towards 1.19-1.18 levels going ahead. The triangle pattern has formed near to its previous high and has reversed. Today it has given a bearish break in this pattern, thereby opening negative possibilities. The summation is GBPUSD can sink towards 1.19-1.18 price range over short term.