Hang Seng - Elliott Wave Analysis
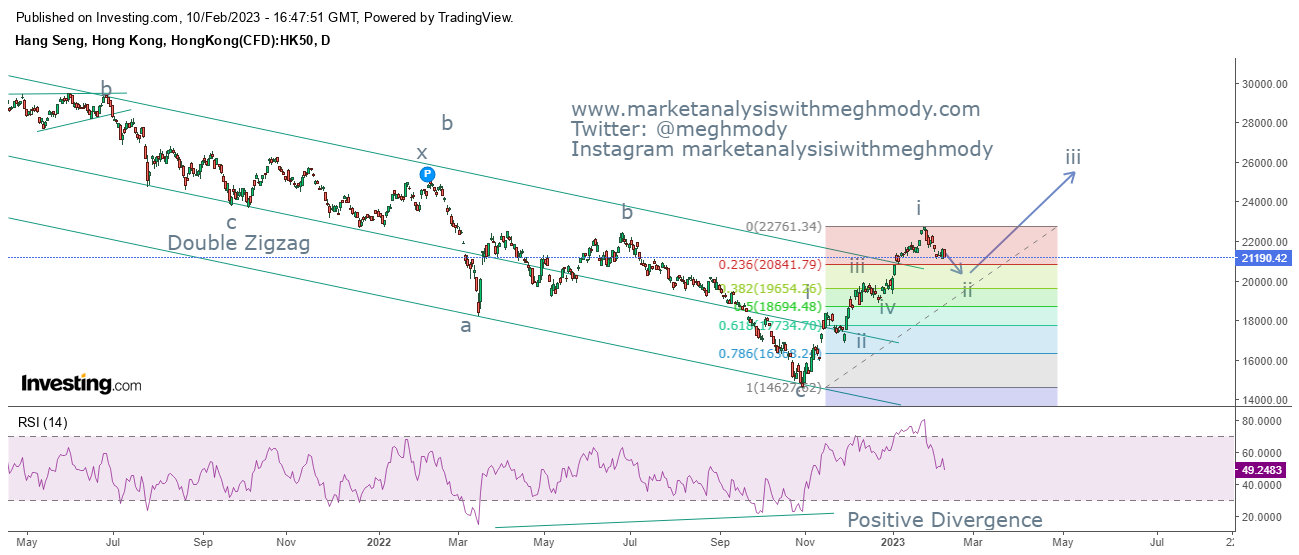
Hang Seng daily chart
Analysis
As shown in the above chart, prices which were moving in a falling channel has closed above it thereby giving bullish break. Along with that, the index was sustaining well above it. Hang Seng after making a high of 22760, has started falling and arrived near to the support of the falling channel (earlier resistance). RSI has also turned negative.
From Waves perspective, the index is moving in wave ii and it seems that wave i is extended, this means that wave ii is unlikely to go below 38.2% from the bottom till 22760 levels. Again this is a guideline and not a rule. The level of support comes to 19600 levels (38.2%).
The summation is Hang Seng is unlikely to go below 19600 and can consolidate in the range of 22760-19600 levels over the time.


Comments