Posts

Showing posts from October, 2019

MCXGold Technical Analysis video

Image
Learn Technical Analysis from me in my 3+ month course schedule every Sunday for more then 3+ hours. Advance Technical Analysis like ElliottWave and NeoWave is done in my two day course for over 12-15 hours. The fees for Technical Analysis is 15000/- INR and Elliott Wave is 15000/- INR. For registration call 9324174580

MCX NatGas and Technical Analysis video

Image
Learn Technical Analysis Course for over 3 months every Sunday for more then 3 hours and become an expert in Equity, Commodity,Forex market. The fees for the above course will be INTR 15000/-  Advance Technical Analysis like Elliott and Neo Wave webinar is scheduled on 16th and 17th November. The fees for it is INR 15000/- which will run over 12-15 hrs. Here is the video

Nifty and it's future path with Elliott Wave analysis

Image
From daily chart, Nifty is moving up by not breaking its previous lows and it is taking support of the upward sloping trend line where it has taken support twice (marked by rectangle). However, new highs are not be made by the index. The falling trend line from the previous top is not allowing the index move above it. So it is imperative for prices to move above 11700 decisively for further positive possibilities to open.  Any move above 11700 will give a confirmation that the trend is positive as it will make higher highs and higher lows. Also there is a bullish crossover of two short term moving averages and now prices are taking support of 20 EMA (red). MACD is above the center line and is also above the trigger line. As per daily waves, prices are moving in wave iii/c. However, price confirmation is still needed which will be obtained after it crosses 11700, failure to do so can change the wave count as it can then make triangle pattern too.  Learn Technical Ana

MCX Crude Weekly chart and Elliott Wave forecast

Image
MCX Crude Weekly chart From the above weekly chart of MCX Crude, prices are moving in a range of 3700-4700 levels. As far as prices persist in this above range, no trending move is expected. Also a keen observation, moving average of 50 SMA is been whipsawed many times giving an indication that there is no clear trend.   From weekly waves perspective, prices are probably moving in a triangle pattern in which last leg which is wave e is on its way. Now wave e may or may not test the upper trend line of the triangle pattern or a-c line. Once wave e is over prices will dip in wave c down which will be a trending move.  Weekly RSI is above the center line, giving an indication that prices are positively poised and can move up going ahead. Learn Elliott Wave and Neo Wave Analysis in my two day paid webinar/Classroom training, running for over 15 hours and the charges for two days will be RS.15000/-. For registration call 9324174580 or mail meghmody@gmail.com

MCX Silver Elliott Wave Analysis

Image
Learn Elliott Wave and Neo Wave Analysis for two days paid webinar running for over 15hours. The fees for the same will be RS. 15000/-. For registration contact 9324174580.

Technical Analysis Explained Nifty, MCX Crude and USDINR Video

Image
Using Technical Analysis and Advance Technical analysis I have forecasted three asset class and its direction for this series and next.  You can learn technical analysis for 3 months. A course designed for you all to learn and practice for sufficient time with me. Elliott wave and Neo wave analysis is for two days. For registration call 9324174580.

GBPINR: Elliott Wave Complex Correction

Image
GBPINR 15 mins chart From wave perspective, GBPINR is expected to reverse as it is on the brink to complete wave a after wave x near the support of the channel. There is still some downside left but a quick recovery will follow.  The entire correction is a complex correction (a-b-c-x-a-b-c). Here in this case it completed wave a of the second correction and so now it will open wave b up which can go till 91.3-91.5 levels. You can learn Elliott and Neo Wave in my two day paid webinar/ classroom training. The running hours will be 12-15 and the fees will be 15000/- rupees per person. For registration call 9324174580.

USDINR: Tumbling near its previous lows?

Image
USDINR 60 mins chart As per Elliott Wave analysis, prices are moving in wave c which can tumble till 70.60-70.4 levels in near term. Th preceding trend was a three wave structure (a-b-c) which was wave b and earlier to that a complex correction (w-x-y) which was wave a.  However, I have only one concern that wave b has only retraced 61.8% of the previous fall, so it cannot be a flat pattern though wave a and wave  b was a three wave structure. So the summation is the entire fall will be wave a as it can retrace 50% of the rise from 68.4 o 72.6. The bias is negative as of now for this pair. Learn Elliott Wave and Neo wav in my two day paid webinar The run time will be 12-15 hrs and the fees will be Rs. 15000/-. Classroom training is also provided. For registration call 9324174580.

MCX Copper: All Set to Soar

Image
MCX Copper Weekly chart In the weekly chart of Copper, prices are consolidating in a range of 400-470 (marked by horizontal lines). As far as prices persist in this range no trending move is expected in this counter. In the month of June price reversed from the support zone of the above mentioned range and is more likely to test the upper extreme of the range at 470. The immediate support will be placed at 430-420 which is the common gap support. There are high chances it will fill this gap by dipping till 420 levels and then it will reverse back up as common gap are more likely to fill. From weekly waves perspective prices are expected to move higher near till 470 where 80% of the previous fall is placed. This 80% comes to 473-476 levels as I think this will be flat pattern. From time analysis, the first fall took 30 weeks where wave a is marked from the top, in wave b which is ongoing has already taken more than 30 weeks which s one of the peculiarities of flat pattern. Thi

Nifty as expected

Image
The below article was written on Sunday before market opened. I was continuously bullish for the index but was waiting for price confirmation. Elliott Wave and Neo wave helps you to understand the possible reversal and riding the entire trend. This is what I have captured. Learn Elliott Wave and Neo Wave in my two day paid webinar. The run time will be 15 hrs and the fees will be 15000/- rupees. In the hourly chart, Nifty has not moved above its previous high and is facing resistance of the falling trend line. It will be important to see what will be the price action on Monday. Any move above 11400 is a buy for prices to reach till 11550-11600 levels.  From wave perspective, I will continue to have two probabilities in the above chart as mentioned last week, one is prices will continue to move in a triple correction pattern (a-b-c-x-a-b-c-x-a-b-c). As of now it has only completed double correction (a-b-c-x-a-b-c). However, any move above 11400 will indicate that prices ha

Nifty: Elliott Wave Forecast

Image
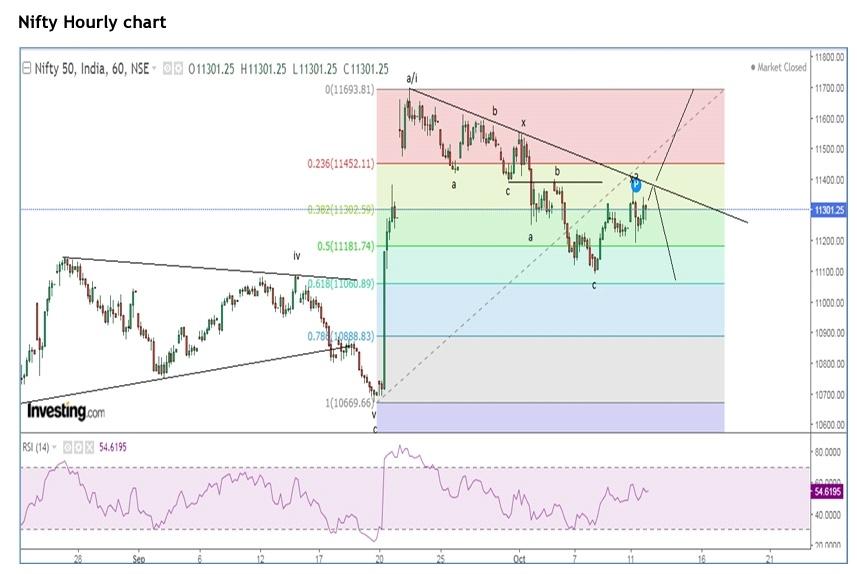
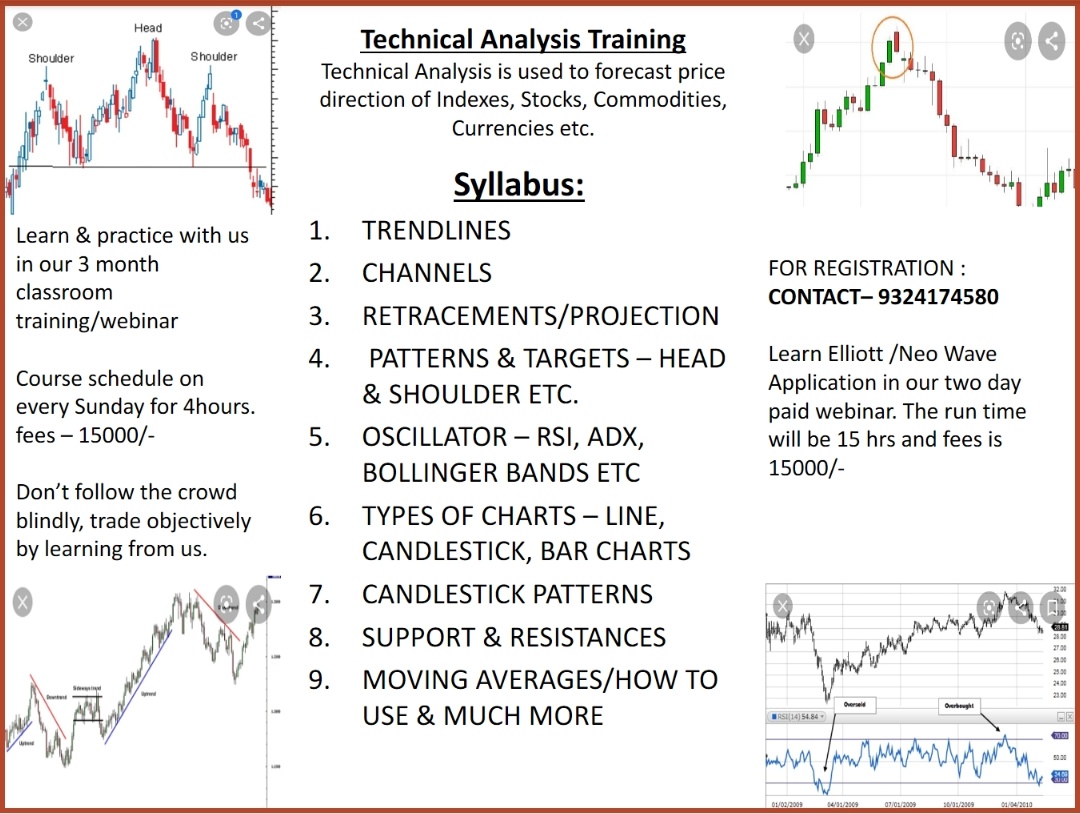
In the hourly chart, Nifty is moving in a lower highs and lower lows formation is moving precisely in a falling channel. Last Friday is closed below the channel support and it is likely that it will re-enter this channel in next week.  From wave perspective, there are two possibilities in the above chart, one is prices will continue to move in a triple correction pattern (a-b-c-x-a-b-c-x-a-b-c). As of now it has only completed double correction (a-b-c-x-a-b-c). However, any move above 11550 will indicate that prices have completed double correction and have started wave iii/c higher. The summation of the above chart is, Nifty will find support near 11050-11100 levels, a bounce can soar price till .... A decisive move above ... will open further positive possibilities, if failed to cross, sideways action can be seen in a range of ..... levels.  Don't waste time and learn Technical Analysis in my 3 month long course. Starting from inception. This course will help yo

Technical Analysis Course

Image
Technical Analysis can't be taught in one or two days. So I have come up with a three month course to teach you in detail about Technical Analysis. This course will help you learn a lot about TA and its applications on Indexes,stocks,commodities and Currencies.  Here is the details. Don't miss this golden opportunity.

MCX Crude: Anticipated Happened

Image
From above hourly chart, prices are now moving in a lower high and lower low after marking a high of 4500 odd levels. The lower highs and lower lows will not favor prices to rise from current juncture.  As per wave theory, prices have completed wave b t one higher degree where the internal counts were (w-x-y) eventually flat pattern as it retraced more than 80% of the previous fall of wave a (4692- 3522). So if wave b is over wave c has already started which is an impulse in nature and can move down till 3750 levels.  The summation of the above two chart is, MCX Crude is negatively poised and can tumble near till 3750 levels as far as 4265 is protected on closing basis.  The above analysis was done on 23rd of September 2019. I had mentioned that it will come down to 3750 which it made a low today by moving down below 3750.  Learn Elliott Wave and Neo wave from us which will be a two day webinar teaching all the important concepts of Elliott and Neo wave in 15 h

German DAX: Revisited

Image
Anticipated on 23rd Sept Happened In my earlier update of German DAX in which I had mentioned that wave v is pending and it will go up till 61.8 % of wave i. I am sharing the link check it out https://www.marketanalysiswithmeghmody.com/2019/09/german-dax-will-slowdown-drag-index.html I made minor change in marking wave iv that also change the target of wave v. Instead of 12600 it made high of 12500 but the last leg which I was anticipating finally happened. Once completed wave v, prices collapsed which can be seen in the above chart. Dont follow the crowd blindly learn Elliott and Neo wave from me. A two day paid webinar for over 15 hrs session and the fees will be 15000/-. For registration contact 9324174580.

USDINR: Complex correction pattern

Image
15 mins chart USDINR reversed from the falling channel resistance today thus continuing lower highs and lower lows formation. It also breached the rising small trend line indicating that the downturn has started. Elliott Wave perspective, as of now prices are moving down in (w-x-y-x-z) pattern in which it is now moving down in wave z. The second possibility is wave a is over where wave y was completed and where second x was completed wave b is over there. This means downside correction is imminent. Lear Elliott Wave and Neo Wave two day paid webinar with me. The run time will be 15 hrs and the fees will be 15000/-. Don't follow the crowd blindly, learn objectively. For registration call 9324174580.