Posts

Showing posts from March, 2022

Bitcoin Revisited Part II

Image
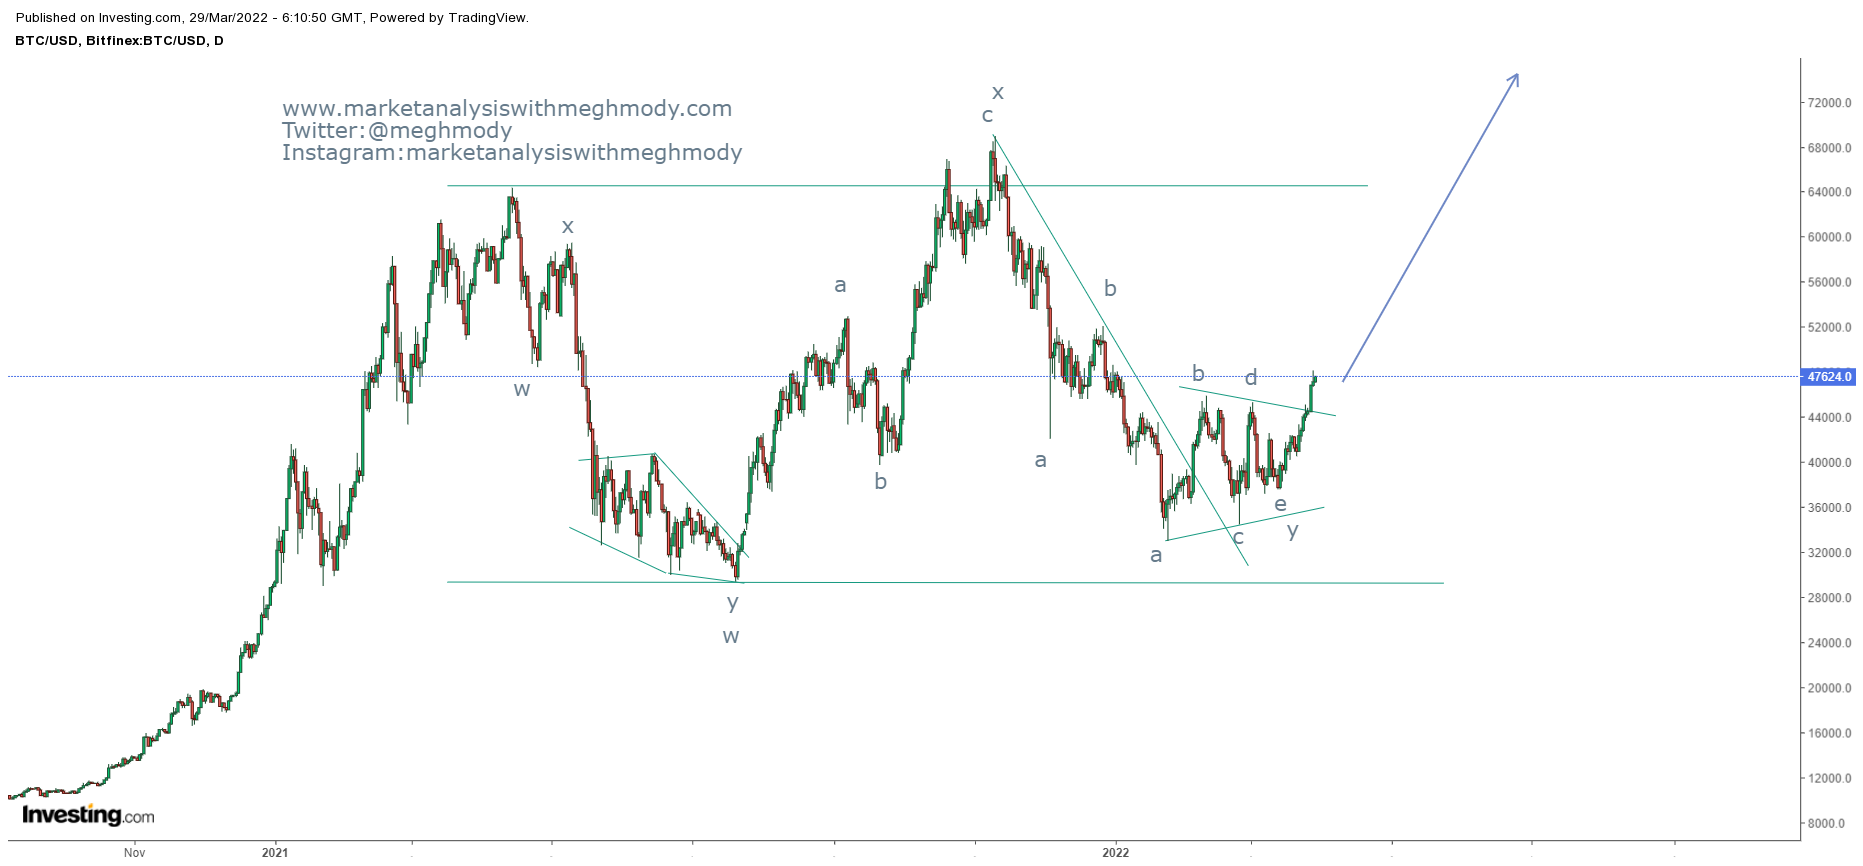
 Bitcoin daily chart As shown in the daily chart, BTC has been moving as per my analysis. I must tell all my readers that from the month of January 2022, I am in a view that Bitcoin will test $75000 this year (2022). To add, last year in the month of July 2021, I had predicted the reversal in this crypto and was successful. This year am expecting reversal. I have written many BTC articles, click on the link to see view the articles Bitcoin Elliott Wave Analysis https://www.marketanalysiswithmeghmody.com/2022/01/bitcoin-elliott-wave-analysis.html Bitcoin Revisited https://www.marketanalysiswithmeghmody.com/2022/01/bitcoin-revisited.html Bitcoin Elliott Wave and Neo Wave Analysis https://www.marketanalysiswithmeghmody.com/2021/08/bitcoin-elliott-wave-and-neo-wave.html As per Elliott Wave, I think wave y is finally over in the form of triangle. This completion has already opened the possibility of moving prices to a new high and to my above mentioned target. The summation is BTC is very p

Nifty Media: Elliott Wave Impulse

Image
 Nifty Media daily chart The index has formed a tremendous foundation at the bottom and from there it started forming higher highs and higher lows which is a positive sign. At present it is precisely moving in a rising channel and has bounced from the channel support. At the lower end of the chart, a bullish reversal pattern is completed. This pattern is bullish cup and handle pattern. The target of the pattern comes to 2900 levels.  From Waves perspective, prices are moving in an impulse fashion where recently it has completed wave iv just on the neckline where it was previously facing the resistance earlier. Now it is moving higher in form of wave v, this wave can exhaust at 2600 mark which is 61.8% from wave i to wave iv or can extend till 100% of wave i = wave iii = wave v which is placed at 2900-3000 levels. The summation is Nifty Media index is positively poised and can move in a positive direction till 2600, a sustainable move above 2600 will open further positive possibilities

Ethereum: Elliott Wave Impulse

Image
 ETH daily chart As shown in the above chart, the trend is firmly positive as prices continue to protect its previous lows. Also the crypto is looking very strong to march north going ahead this year. From waves perspective, prices are moving in a impulse fashion from Dec 2018 till date. Here, ETH has completed wave 1 to wave 4 and it is all set to start wave 5 higher. This wave 5 can move towards $6000-$6100 levels over medium term. The summation is, ETH is positively poised and can move higher near till $6000-$6100 levels over medium term.

EURINR: Possibility of Reversal with Elliott Wave Analysis

Image
 EURINR spot 60 mins chart anticipated on 21st Feb 2022 EURINR spot 60 mins chart happened 7th Mar 2022 From my previous update in EURINR, I had mentioned that, " EURINR is negatively poised and can test the level of 81 over short term." Prices faltered till 83.5 and is showing signs of reversal which indicates that it wont sink further but will move up. I have made a serious attempt for the pair to tumble which it did to a certain extent. To view my previous article on EURINR, click on the below mentioned link https://www.marketanalysiswithmeghmody.com/2022/02/eurinr-elliott-wave-analysis_21.html As per wave analysis, I think prices have completed wave a at one higher degree and now wave b has started which can go up from current levels.  The summation is EURINR is all set to reverse and can reach a level of 85-85.3 levels over short term.

Nifty Metal Index: Elliott Wave Anlysis

Image
 Nifty Metal Index daily chart From the above chart, prices are moving in a higher highs and higher low and it continues to surge. The index is showing a immense strength and can even cross its previous high going ahead. As per Wave Analysis, the index has completed wave a in double correction and it is currently moving in wave b which can be a flat pattern (a-b-c), mostly irregular flat which can go to 6570 to 6750 levels. The summation is Nifty Metal Index is positively poised and can move towards 6570-6750 levels over short term.

EURUSD: Symmetrical Triangle

Image
 EURUSD Weekly chart From the above weekly chart, prices are moving in a sideways direction from past seven years and it seems that this sideways action is turning out to be completing symmetrical triangle pattern. As per wave theory, prices have completed all the legs of the triangle pattern and it is now set to move higher from current levels. The single currency can move close to 1.20-1.22 levels which will be the post pattern implication (Thrust) The summation is EURUSD is all set to soar till 1.20-1.25 levels over short to medium term.

Solana: Elliott Wave Analysis

Image
 Solana daily chart As shown in the above chart, prices are moving in a positive direction as none of the previous bottoms has been breached. It will be important to see if the current fall will break the previous higher bottom placed at $20 levels where cluster of supports are placed. From Waves perspective, prices have completed impulse wave (1-2-3-4-5) and it is currently moving in corrective mode. I think it is moving in wave A in which double correction is seen.  The summation is, Solana is likely to move down to test the level of $25-$20 levels over short to medium term.

Hang Seng Fut: Double Correction?

Image
 Hang Seng  Daily fut continuous chart From the above chart, prices are moving in a lower highs and lower lows which indicates that the trend is negative. However, the index has bounced from the lower end of the falling channel which opens the possibility of a resilience. As per Elliott wave, prices have completed a corrective wave a-b-c and there is a high possibility for wave x to form. However, if prices break this falling channel then new high is imminent and the index can soar ahead. The summation is Hang Seng is likely to move up till 28000 levels over short term.

MCX Silver: Symmetrical Triangle completed

Image
 MCX Silver daily continuous contract Prices which were moving in a sideways consolidation pattern from August 2020 till dats looks to be on the brink to be completed. MCX Silver has eventually completed symmetrical triangle pattern after its wave e got completed at 73078 levels. Now there are high chances that the bullion cum commercial metal will slump from current levels. To understand lets us jump to the advance technical analysis.  As per Elliott Wave prices were moving in a symmetrical triangle and prior August 2020, the bullion was moving in a complex corrective pattern. This triangle looks to be the last leg of the ongoing upmove and will reverse going ahead. I have previously had written an article on MCX Silver, to view it click on the link https://www.marketanalysiswithmeghmody.com/2022/02/mcx-silver-in-symmetrical-triangle.html The summation is MCX Silver is poised to falter till 50000 levels over short to medium term.

GBPINR: Anticipated Happened

Image
 GBPINR 60 mins spot chart anticipated on 21st Feb 2022 GBPINR 60 mins spot chart happened on 14th March 2022 In my previous update dated 21st Feb 2022, I had mentioned, "  GBPINR is all set to plunge till 99.5-99 levels over short to medium term." The pair plunged till 99.58 at 10.30 IST, gaining 1.90% and it is looking weak going ahead - Anticipated Happened To view my previous article on GBPINR, click on the below link https://www.marketanalysiswithmeghmody.com/2022/02/gbpinr-third-correction-starts.html Prices have arrived near cluster of supports marked by arrow so one can partially book the pair at current juncture. Break of 99.5 can accelerate selling pressure going ahead but from here it seems downside is limited. As per wave theory, prices are on the brink to complete wave a of third correction and then it will start wave b higher which can move the pair back till 102 levels (spot).  The summation is GBPINR can test 99 levels but will reverse the direction to move ba

USDINR: Neo Wave Expanding Triangle Running Variation

Image
 USDINR spot daily chart In my previous article for USDINR, I was in a conclusion that there is an extracting triangle in wave y and then it can slump down towards 73.5 levels. However, prices continue to move higher thereby negating the extracting triangle. To read the article of USDINR Extracting Triangle, click on the below link https://www.marketanalysiswithmeghmody.com/2022/02/usdinr-neo-wave-extracting-triangle-in.html Here in the above chart, I think prices are now moving in a Neo Wave Expanding Triangle which is a Running Variation. This will end wave b on the higher side and wave c down will open leading it till 74.3 levels over short term. Running Variation in Expanding Triangle is more like a trending move up and looks like moving in a higher highs and higher lows. The summation is USDINR can reverse the direction any time soon and can test the level of 74.3 (spot ) over short term.

ACC: Neo Wave Diametric Pattern Anticipated Happened

Image
 ACC daily chart anticipated on 21st Feb 2022 ACC daily chart happened on 7th March 2022 In my previous update for ACC, I had mentioned that, "  ACC can move down till 1850 levels over short term, once the level of 2100 is broken decisively." Prices slumped after breaking 2100, opening well below it and made a low of 1900 which was close to my mentioned target of 1850, gaining 9.52% - Anticipated Happened To view my previous article on ACC dated 21st Feb, click on the below link https://www.marketanalysiswithmeghmody.com/2022/02/acc-neo-wave-diametric-pattern.html The current fall is an impulse and prices are now moving higher to form wave b or wave ii, so the short term bias is positive and will continue to monitor the movement as and when the wave unfolds.

Bank Nifty: Neo Wave Extracting Triangle and Forecasting

Image
 Nifty Bank 60 mins chart As shown in the above chart, prices are moving in falling channel and it has showing sign of reversal from the support of the channel. Today the fall after the shaded portion which is moving down in a small falling channel is broken thus opening positive possibilities. As per Neo Wave Analysis, I think wave a was completed at 34215 levels followed by wave b in Extracting Triangle pattern and wave c at 32150 levels. Also wave a is equal to wave c i.e. 100%. This means prices are at confluence zone of Fibonacci levels along with trend line support. So now the index can move higher from here till 37000-37300 levels over short period of time and continue wave x or can break this channel. Just like Nifty, Nifty Bank can also break channel and soar. The summation is Nifty Bank is positively poised and can move higher from current levels towards 37000-37300 over short term.

Nifty: Neo Wave Neutral Triangle and Forecasting

Image
 Nifty 60 mins chart In my previous update I had mentioned that prices are suppose to move higher but it continued to dip. Today it is showing signs of resilience as a failed pattern has eventually confirmed. To view my previous article of Nifty, you can click the below link https://www.marketanalysiswithmeghmody.com/2022/02/nifty-elliott-wave-analysis-anticipated.html In the above article I had mentioned that Nifty will soar till 17600-17800 levels, this will happen going ahead as the index has re-entered the falling channel. The falling channel was broken on 7th March and it seems that more shorts at that point was added. However, as soon as it re-entered the channel which is today, short squeeze cant be ruled out which can infuse buying pressure and fresh longs can also be seen. In my previous article if I go as per Elliott Wave I have come up with W-X-Y pattern. If I apply Neo Wave analysis I have come up with a corrective pattern a-b-c pattern where wave b is a Neo Wave Neutral Tr

Power Finance Corporation: Anticipated Happened and Neo Wave Extracting Triangle

Image
 PFC hourly chart anticipated on 24th January 2022 PFC hourly chart happened on 28th February 2022 In my previous update on PFC, I had mentioned that, " PFC is set to plunge till 105-104 levels from current levels over short to medium term." The stock faltered till 106.9 from 117 gaining 8.54% over a months time. The level of 106.9 is close to my mentioned level - Anticipated Happened To view my previous article on PFC, click on the below mentioned link https://www.marketanalysiswithmeghmody.com/2022/01/power-finance-corporation-elliott-wave.html Prices can resume the downtrend as the major trend continue to be negative and can move back till 104-105 levels over short term. As per Wave theory, prices formed a Neo Wave Extracting Triangle in wave b and it is now moving or completed wave c lower. As far as prices continue to persists in the falling channel the bias remains negative.