Posts

Showing posts from January, 2016

Nifty and Bank Nifty: Anticipated Happened and Wave forecasting.

Image
In my previous update dated 15 th October 2015 “ Nifty in an expanding triangle ” followed by “ Nifty on brink to reverse ” dated 24 th October 2015 and “ Nifty to sink after confirmation ” dated 11 th November 2015, I mentioned that Nifty will moved down to test the level of 7500 followed by 7200. In the early January 2016 Nifty made a low of 7240 thus achieving my mention levels of 7500-7200 levels. Even for Bank Nifty, my view was negative. I had mentioned that “ any move below 17430 will open negative possibilities for this index which can drag prices near till 15550 levels ” on 24 th October 2015. Bank Nifty made a low of 14754 levels on 20 th January 2016, thus achieving our mentioned level of 15550. The broader index fell to almost 8% this year and it seems that the worst is here to stay. However, there can be a reversal for both the indices over short term. As we are aware that both the indices are moving in a declining channel, forming a lower high

MCX Natural Gas to halt its rally

Image
MCX Natural Gas has surged more than 60% from the bottom of 114 levels. It made a high of 165 in the month of January 2016. From the below daily chart, prices were moving precisely in a rising channel which is broken today giving an indication that the upside rally will halt. Break of rising channel opens bearish possibilities, as the support of the channel is at 159, Nat Gas is expected to shed gains. Currently prices are quoting at 155 levels. RSI on daily chart has exhibited negative divergence which is an indication that the positive momentum is slowing down. Please note that the larger trend continues to be positive as of now. From waves perspective, prices moved in an impulse fashion from 114 till 165 levels. After five wave structure, prices are tend to correct which is termed as counter wave. The counter wave will be a three wave structure (a-b-c) and can move in a range of 146-150 levels. In short, expect prices to fall  till 146 levels going ahead. MCX Natural G

MCX Gold to test 27k?

Image
Gold prices have started soaring from the month of January 2016 and it seems it will continue to move higher. Gold prices in US (XAU) has formed a basing formation and probably have started to move in positive direction on the expectations that FED will not hike the interest rate in the month of January 26th & 27th 2016 thus rising the demand for safe haven. MCX Gold has also bounced  from crucial support of 24,937 and moved till 26,123 in five trading days. Technically it bounced from the lower end of the falling red channel. Now it can move higher to test the level of 27,000 which is the resistance of the channel. As per wave theory, the yellow metal is moving in a triple corrective pattern (a-b-c-x-a-b-c-x-a-b-c). In this case it has completed the second counter trend which is wave x on 21st August 2015 at 27,833 followed by wave a at 24,937. Currently it is moving higher in the form of wave b which can move near or closer till 27,000. In short, expect prices to move

EURINR: Neutral triangle in making (Neo Wave)

Image
EURINR is moving in a range of 71-74 levels from past two months. Last closing of this pair on Friday 8th January 2016 which was 72.49.The below daily chart reflects NDF quotes as well. Prices are moving in a triangle pattern, not a symmetrical, barrier or expanding triangle but Neutral triangle which is a part of advance Elliott wave theory. In a Neutral triangle, like other triangle patterns there has to be five corrective waves in it (a-b-c-d-e). However, in Neutral triangle wave c has to be longest in comparison with wave a and wave e. From the below daily chart, the first up move is roughly 7 points, the second upmove is of 9 points and the last is roughly 4 points indicating a clear picture of Neutral triangle pattern. As per Neo wave, prices are currently moving in the last leg of wave e of triangle pattern. After completing of this pattern, the pair will move down which will be termed as a thrust post triangle pattern. In short, expect prices to consolidate near 72-

Will there be a short term bounce back in MCX Crude?

Image
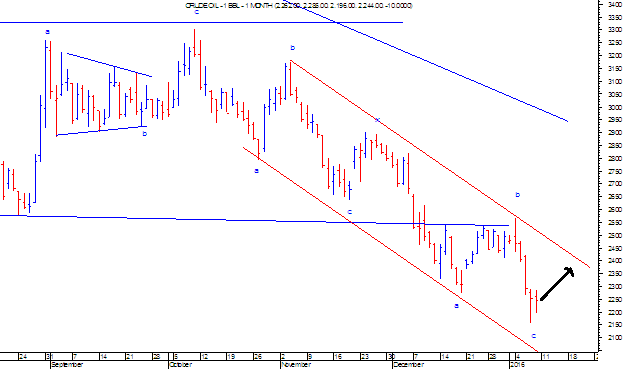
Rising tensions in middle east has dragged the prices of Oil to its 11 year oil in the global market. MCX Crude oil also faced the heat thus giving up 410 points in last four days. Crude oil is moving is a firm down trend. However it has arrived near crucial support. From the below chart it is clearly visible, that prices are moving in a downward sloping red channel. On Friday prices closed near the support of the falling channel clearly indicates that short term bounce back can't be ignored. From Waves perspective, Prices have completed double corrective pattern (a-b-c-x-a-b-c). Now prices will move higher in the form of new leg.  In short, the downside seems to capped as prices can witness a bounce back to test the level of 2300 over short term. MCX Crude Oil Daily chart

USDINR: Alternative Wave Counts

Image
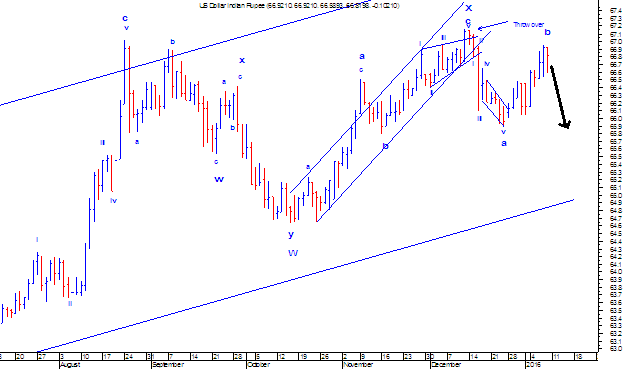
In my previous post of USDINR " USDINR: Implusive Wave", I had mentioned that probably the pair will reverse and can test the level of 65.50. However, prices moved above 66.40 which was a crucial resistance thus breaking the downward sloping red channel. Now to understand the current setup it is imperative to see the bigger picture. From the below daily chart, from August 2015 till date. Prices are moving in a range of 64.80-67 levels. As per wave theory, the fall from August top i.e. from 67.01, prices moved in a 3 wave structure (a-b-c) and completed one higher degree at 64.63 levels. Thereafter, when it started moving up it again touched the high of 67.15 in 3 wave structure (a-b-c). Now the fall from 67.15 which earlier looks to be am impulsive can also be counted as (a-b-c) which is complex in nature.  Last week the pair crossed the high of 66.40 and made a new high of 66.94 levels. The current up move is also a corrective structure and I placed it as wave b, w

MCX Aluminum: Post Ending Diagonal pattern

Image
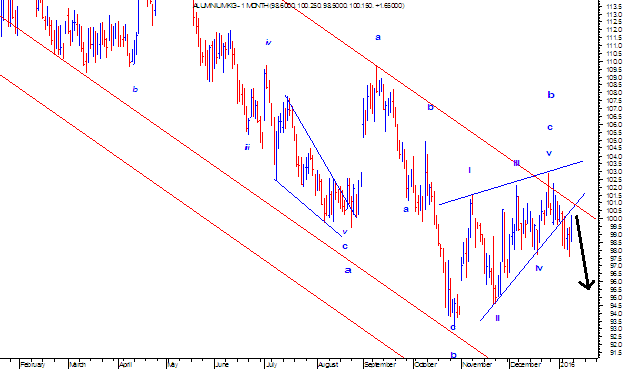
MCX Aluminium is moving down by forming a lower high and lower low formation. The metal is also moving precisely in a falling red channel. As of now it is consolidating near the channel resistance and it is getting ready to reverse. Prices are moving down in a simple (a-b-c) or (w-x-y) pattern as of now. Recently it completed wave b in which the last leg i.e. wave c was an ending diagonal pattern. Now it can move down in the form of wave c which can be an impulse on the downside or wave y which can be further corrective pattern, but both the alternatives suggests that one leg on the downside is pending. In the below chart, after completing the ending diagonal pattern, prices moved below the lower trend line of the wedge pattern and then it pulled back to test the lower trend line again. This clearly suggest that it has arrived near the resistance. In short, expect prices to move down near till 95 levels over short term as far as the level of 100.90 is intact on the upside

MCX Copper: Capturing the downfall

Image
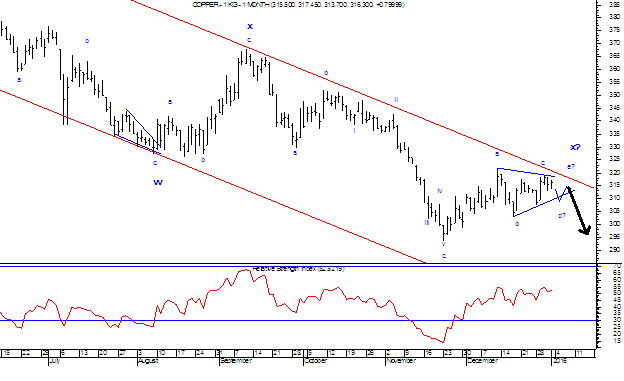
In my previous update " MCX Copper moving in a symmetrical triangle pattern and its post pattern implication". I had mentioned that,    prices will consolidate within range of 315-320 levels and then will reverse to test the level of 295. Prices moved in a thin range 308-315 and completed that triangle pattern on 6th January 2016. Once the pattern was completed, prices opened below the lower trend line of the triangle pattern and made a low of 296.45 on 7th January 2016. As per wave theory, Currently a new leg on downside has started which can drag prices further lower till 290 levels. After completing wave x in a triangle pattern, prices will now move down in the form of wave a. In short, expect Copper to be under pressure and can test the level of 290 going ahead. The resistance will be 308-310 which was earlier acting as a support (polarity reversal). Link:  http://marketanalysiswithmeghmody.blogspot.com/2016/01/mcx-copper-moving-in-symmetrical.html MCX Copper 1

MCX Copper moving in a symmetrical triangle pattern and its post pattern implication

Image
MCX Copper is under performing after China started slowing down in the mid of 2015. Since then it is moving precisely in a down ward sloping red channel by forming a lower high and lower low formation. Currently it is consolidating near the resistance of the red channel. It is imperative for prices to reverse, thus continuing the downtrend. However, it seems that before it reverses, it will consume some time and will trade in a thin range of 315-320 levels as it is forming a crucial pattern. As per wave theory, prices are moving in a complex correction pattern (w-x-y-x-z). Currently it is moving in a triangle pattern which is the second counter trend i.e. wave x. In wave x still wave d and e are left to form. After completing triangle pattern, prices will move down in the form of wave z. In short, prices will consolidate within range of 315-320 levels and then will reverse to test the level of 295. MCX Copper February'16 Contract Daily chart

USDINR: Impulsive Wave

Image
From the below Daily chart it is clearly visible that the current trend for this pair is negative. Even by using simple channeling techniques one can understand the trend of the asset class. In this chart prices are moving in a falling red channel which is downward sloping. Prices are expected to move lower after breaching the ending diagonal pattern. The current fall is steep thus giving an indication that the trend is here to stay. As per wave theory, in October 2015 when prices were quoting near to 64.80 levels, the pair moved higher in a three wave structure (a-b-c) and completed on higher degree. After completing wave c 67.15 in an ending diagonal pattern, prices are moving down in a impulsive pattern which has five wave structure in it. Currently it completed wave ii which is a counter trend at 66.40 levels. Now it will resume the downtrend by starting with wave iii, which can move down till 65.50 levels. In short, prices are negatively poised and can move down goin