MCX Copper: Capturing the downfall
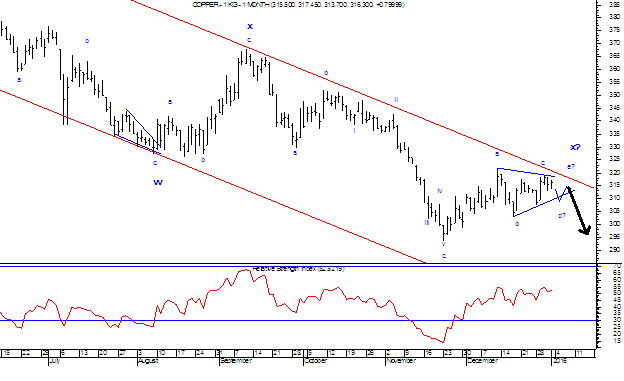
In my previous update " MCX Copper moving in a symmetrical triangle pattern and its post pattern implication". I had mentioned that, prices will consolidate within range of 315-320 levels and then will reverse to test the level of 295.
Prices moved in a thin range 308-315 and completed that triangle pattern on 6th January 2016. Once the pattern was completed, prices opened below the lower trend line of the triangle pattern and made a low of 296.45 on 7th January 2016.
As per wave theory, Currently a new leg on downside has started which can drag prices further lower till 290 levels. After completing wave x in a triangle pattern, prices will now move down in the form of wave a.
In short, expect Copper to be under pressure and can test the level of 290 going ahead. The resistance will be 308-310 which was earlier acting as a support (polarity reversal).
Link: http://marketanalysiswithmeghmody.blogspot.com/2016/01/mcx-copper-moving-in-symmetrical.html
MCX Copper 1st month chart (Daily)
Anticipated on 2nd January 2016
Happened on 7th January 2016


Comments
Tata Motors
Aurobindo Pharma
Bank of Baroda
Welspun Enterprises
VIP Industries
Tata Motors
Aurobindo Pharma
Bank of Baroda
Welspun Enterprises
VIP Industries