Posts

Showing posts from January, 2020

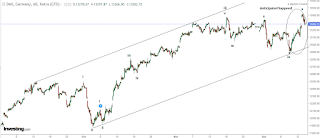
MCX CRUDE OIL: Anticipated Happened ElliottWave forecast

Image
MCX Crude oil Anticipated on 31st Dec 2019 MCX Crude oil Happened in last week of January 2020 In my previous update I had mentioned that Crude oil is on the brink to fall when it was near to 4400-4500 levels. This you can check in my below mentioned link all you have to do is click on it. https://www.marketanalysiswithmeghmody.com/2019/12/mcx-crude-oil-wave-b-in-triangle.html Coming back to this article now, prices were then supported after a air strike by US on IRAN but it was short lived which made the black gold tumble back again. I had mentioned about triangle but was not sure, but now I am as this will not be a triangle and so I have marked w-x-y pattern. After this pattern was over prices came to my mentioned level in the above link which was 4150 followed by 3800.  Learn Elliott Wave and Neo Wave in my 4 day webinar/classroom training. Cost for the same is RS.10,500/- or $155. For inquiry contact +910324174580. You can also subscribey YouTube channel

AUDUSD ElliottWave forecast

Image
Weekly chart of AUDUSD Form the above chart I can see that five Waves down is over and prices are now poised to move higher from current CMP. Well it is early to say that this can be a reversal or a fresh leg up, I think wave b is in making which will not go above 61.8% of previous down wave. In this case I am expecting that prices will move up till 0.80 now. Learn ElliottWave NeoWave, a four day course for you all. Webinar and classroom training is available. The cost will be RS. 10500 or $155. For inquiry call +019324174580.

Egypt EGX30: Elliott Wave Forecast

Image
EGX30 Weekly chart From the above chart, prices are moving in a inverse ascending triangle and is all set to tumble down. This inverse triangle will not exceed 61.8% of its previous wave, which means that the previous wave was wave a and current ongoing wave is wave b and wave c is pending down. This wave c lower will complete wave iv of wave iii in a zigzag pattern. One this zigzag pattern is over wave v of wave iii will start which can soar prices near till 190000 levels. As wave iii is extended one so all the internal waves will be similar to wave i and wave ii. In terms of wave iv of wave iii it can be 61.8-161.8% of wave a. However, 161.8% is unlikely as it will overlap wave i of wave iii so 61.% of wave a to wave b will end wave c and wave iv of wave iii around 110000. Learn Elliott Wave and Neo wave in my 4 day course a classroom training and webinar, the cost will be Rs. 10,500/- or $155. For inquiry call +919324174580.

Dubai DFMGI: Elliott Wave Forecast

Image
DFMGI Weekly chart From the above chart, I have come to a conclusion that DFMGI is all set to start a fresh leg up in form of an impulse wave as it has completed wave (a-b-c) and it now moving up in form of wave (i-ii-iii-iv-v). In which it is likely that wave i looks to be expanding leading diagonal pattern, once that is complete wave ii will dip close to 61.8% of wave i followed by wave iii higher. My target for DFMGI will be 3800-4000 levels as it completes wave iii of wave i at one higher degree. Learn Elliott Wave and Neo wave with me in my 4 day course (webinar/classroom training). The cost will be Rs. 10,500/- or $155. For inquiry contact +919324174580.

ISRAEL TA35; Elliott Wave forecast

Image
TA35 weekly chart TA 35 an index of Israel is moving in a higher highs and higher lows by taking support of the earlier resistance. the overall picture is compelling and prices are poised to move up going ahead. Any dip can be utilised as a buying opportunity. From wave perspective, prices are moving in a fifth wave extension there are chances for fifth wave extension within extension. As of now I am giving a level of 1900 for the index to conquer. Overall the trend is firmly positive. Learn Elliott Wave and Neo wave with me in my 4 day course webinar/classroom training for Rs, 10,500/- or $155 for inquiry call +91924174580.

OMAN MSM30 Elliott Wave Forecast

Image
MSM30 Weekly chart MSM30 is an index of OMAN and is all set to soar in coming weeks. This index is now positively poised and can move up dynamically after a bearish trend line break. At this juncture, prices are above the trend line even after the throwback. This means that a dip in price is also a buying opportunity. RSI on weekly chart has exhibited positive divergence which means that negative momentum is cooing off. As per wave theory, prices have completed wave C in a five wave structure (i-ii-iii-iv-v) which means now there are high chances that prices will reverse. For short term I am expecting 4400 for this index to reach. Overall for long term perspective, prices can move up and start new leg after (a-b-c) pattern of wave 2 at one higher degree is done. Learn Elliott wave and Neo wave in my 4 day webinar or classroom training. This course will teach you indepth analysis of how markets perform. The cost of the webinar/classroom training wil be Rs, 10500/- or $155

Turkey ISE100 Index Elliott Wave Forecast

Image
Monthly chart of ISE 100 (Turkey) Learn Elliott Wave and Neo Wave in my 4 day webinar o classroom training for the cost of Rs 10500/- of $155. For inquiry call +919324174580. After forming wave a and then wave b in a triangle pattern, prices are all set to move up in an impulse in which it has completed wave i followed by wave ii and currently it is moving in wave iit can move above  which can be longest wave and remember it is a monthly chart which means it can move above 1,30,000-1,35,000 mark.

Abu Dhabi Banking and Finance and Investment and finance index

Image
Daily chart of ADXBF Daily chart of ADXFS From the above first chart, ADXBF is possibly trading in a running triangle pattern which is completed and wave v will start surging prices till 11100 levels, this will complete wave iii then it will correct in form of wave iv which can go below 10000 and after that wave v at one higher degree can start, may be at 11700 levels. In the second chart, a perfect A-B-C pattern is completed which will either open fresh leg up or possbiliy of a complex correction. In both cases chances are high for prices to move up near till 1800. Learn Technical Analysis course, a 4 month course scheduled every Sunday for over 3 hours for in-depth understanding of markets. ElliottWave NeoWave Classroom training and webinar training is also available which will be 4 day course and the fees will be RS 10500/- or $155. For inquiry call +919324174580

USDINR: Change in wave counts but not the view

Image
USDINR Fut Contract (Jan) In my previous update I had mentioned that USDINR will move till 73-73.5, however, it reversed from the supply zone of 72.5-72.8 levels. This is an indication that a range bound move is on its way. Recently it bounced from the support of the range and I also think that it could be a completion of complex correction pattern. (w-x-y-x-z). I have to change my wave counts but my view is as usual bullish which can soar prices near till 73-73.5 in near to medium term. Learn Elliott Wave and Neo Wave in 4 days for the cost of 10500/- Rs or $155 for inquiry and registration contact +919324174580. Classroom training and webinar both are available.

Axis Bank: Bounce from the support and Elliott Wave Analysis

Image
Axis Bank Daily chart Axis Bank is moving in a sideways pattern (marked purple color), this range is of 60 points from 705 765. Prices persists in this range, as far as it does no trending move is expected. recently its quarterly results were announced which was robust. Prices bounce from the lower end of the support range which and is now moving towards 765. As per wave theory, prices are moving in wave b/ii, once this is complete wave c /iii will open which can surge price to 820-830 levels which is 100% of wave a/i, which is in leading diagonal formation. Learn Elliott and Neo Wave with e in a 4 day course which will be a classroom training or a webinar. The cost will be Rs 10500/- or $155. For inquiry contact +919324174580.

Glenmark pharma: Elliott Wave forecast

Image
Glenmark daily chart This pharma stock has been underperforming in 2019 but off recently it has shown signs of resilience. I was too optimistic for metal and now for Auto but it seems that pharma will start surging in 2020. I have placed manual wave counts and came to a conclusion that this stock is set to soar near to it's resistance level. As per wave theory, prices have completed a-b-c  pattern an has started new leg up. It is too early to say if it's reversal or just a bounce back, so I am expecting the latter one. This pharma stock is poised to move till 480 levels from current juncture. Learn ElliottWave and Neo wave with me in my 4 day course which will cost RS, 10500/-. For inquiry and registration call +919324174580.

Maruti Suzuki: ElliottWave Forecast

Image
Maruti Suzuki daily chart I was bewildered when I first saw this chart, but later when I started calculating the wave counts it felt that it is so perfectly poised to soar. Here I present you the wave counts of Maruti Suzuki. Before you read the explanation, I am here to announce that you all can learn ElliottWave and NeoWave analysis with me which is set to start in February 2020. This will be a 4 day course and the fees will be RS. 10,500/- for inquiry call +919324174580 In the first half of the chart vertically you can see an impulse rally where in wave v was truncated. Also after that wave a-b-c was have a Fibonacci connection where wave c was 61.8 of wave a. Now fresh leg on the upside has started where in wave i i los to be a leading expanding diagonal and wave ii retraced 38 .2% and now wave iii has started which looks to be extended. Now minimum criteria is 100% of wave i, which means wave iii can go till 9200. But the rule of extension says that it can advance near

Nifty Auto: Short to medium term forecast

Image
Video Learn Technical Analysis course starting from 9th Feb 2020. A four month course which will cover from basics to advance technical analysis. For inquiry and registration call +919324174580

Tata Steel: Using Technical tools

Image
Video Learn Technical Analysis, a four month course where it will start from basics to advance concepts and making you understand the importance of risk management along with investment and trading purpose. For inquiry call +919324174580.

Nifty Video Dow Theory, ElliottWave forecast

Image
Video Learn Technical Analysis course which is a four month course starting from 9th Feb every Sunday for 3 hours. Learn theory and practical application of all the theories from inception. The course fee and other inquiries contact +919324174580.

Free Seminar on Technical Analysis on 19th January 2020

Image
An important announcement please read the below article For address call on the above number and registration.

DAX: Anticipated Happened and Elliott Wave Forecast

Image
DAX Anticipated on 14th December 2019 DAX Happened on 7th January 2020 In my previous update dated 14th Dec 2019, i had mentioned that DAX is all set to plunge near till 12900 levels from the highs of 13400. This fall was anticipated on 14th December 2019 and it made a low of 12950 on 7th January 2020 thus coming close to my mentioned level. Here is the link to see the previous article on DAX where I had anticipated. https://www.marketanalysiswithmeghmody.com/2019/12/german-dax-anticipated-happened-and.html Now let us understand what is going to happen next in German DAX. With use of Elliott Wave theory, I have come to a conclusion that the index is on the rink to cross 13400 levels and set to move beyond. The minimum target will be in-between 38.2-61.8% of wave iii-wave iv which comes to 13800-14300 levels for DAX. This will be wave v on one higher degree. Now this is not difficult to analyse, you can learn Elliott Wave and Neo Wave in Webinar/Classroom traini

Bitcoin and Ethereum Elliott Wave forecast

Image
Daily chart of Bitcoin Weekly chart of Ethereum Not so long ago I have prognosticated that Bitcoin will tumble down till 3500$. This forecast is still valid. Here I have come up with a short term forecast where I have mentioned that wave a after wave x will start soon or might have started.  This wave a can move down till 6500$ or even lower near till 6200$ where the channel support is placed. For Ethereum it is very clear that one more leg on downside is pending. In this case that is one higher degree it has already started. This leg down can go beyond 79$ in for of wave c or wave y. Learn Elliott-Neo Wave in my four day classroom training. The fees will be INR 10,000/- or $155. For inquiry and registration call +919324174580.

MCX Nat Gas: Symmetrical Triangle and ElliottWave forecast

Image
MCX Nat Gas weekly chart MCX Natural Gas is set to plunge near till 125-120 levels as cluster of supports are placed at this level. It is also to be seen that a classical triangle pattern is formed within which prices are moving.  As per wave theory, prices are moving in a corrective pattern in which last leg is triangle. In triangle prices are moving in last leg which is wave E. This can tumble prices near till 125-120 levels. Once it is over, prices are likely to reverse. Learn ElliottWave NeoWave analysis in my 4 day course where I will teach theory and practical application of all the advance technical analysis. The course fee is Rs. 10,000/-. For enquiry/registration call +919324174580

Nifty Midcap 100: Elliott Wave forecast

Image
Nifty Midcap 100 weekly chart Nifty Midcap 100 is moving in a positive trend as none of it's previous lows have breached since 2008 crash. Also as far as continuation of higher highs and higher lows are intact the trend remains positive. From Wave perspective, prices are moving in wave 4 after completing wave 3 in five wave structure. In wave 4 it has completed wave A in a Diametric pattern and have started moving higher in form of wave B which can surge minimum 80% from the end of wave 3. This suggests that prices are positively poised. Learn Elliott-Neo Wave in my webinar/classroom training for 4 days. The course fees is RS. 10000/-. For enquiry/registration call +919324174580

Bajaj Electric: Video on Technical Analysis

Image
Technical Analysis course is set to start in January 2020. This course will help you to understand free floating market movements and how it functions. The course will be for 4 months and it will be a classroom training in Mumbai. In the course the syllabus will start with basic and will end near to advance concepts of Technical Analysis. Don't miss this opportunity. For registration call +919324174580. 

Bombay Burmah: ElliottWave forecast

Image
BBTC Daily chart The stock is all set to soar near till 1800 levels as wave c of wave b or wave iii on the upside is pending. The preceding trend is a three wave structure which can be wave 4 or wave a. I have marked wave a but will be open for both the scenarios. Also 80% is minimum criteria where the stock can surge.  Elliott-Neo wave webinar/classroom training is set in January 2020. Register by call me +919324174580. The fees is INR 10,000/-. 

Mahindra and Mahindra: ElliottWave forecast

Image
M&M weekly chart Prices of this auto sector has surged in 5 wave structure which is very evident in the above chart. It is also to be seen that after making an all time high where I have marked wave 5, it reversed from the top in a five wave structure where I have marked wave a at one higher degree. This means that prices are now set to soar for B leg which can go up till 61.8% retracements of wave a. This can lift prices near till 800 levels. Learn Elliott-Neo Wave in a webinar/ classroom training which will be 4 day course and will be a combination of theory as well as practical application session. The course fee will be INR 10000/-. To book seats call +919324174580.

Tata Motors: A-B-C pattern (Elliott Wave Forecast)

Image
Tata Motors Daily chart Elliott Wave and Neo wave webinar/classroom training is set in January 2020. This will be 4 day course and will be teaching theory as well as practical application for RS 10,000/-. For registration call +910324174580 In Tata Motors prices have shown sings of reversal and have started climbing. In the preceding trend we can see five Waves down and before then Wave A and Wave B. The five Waves down is where wave third of wave three is extended and it completed wave C lower. This indicates that Wave A-B-C is over and now fresh leg up is on its way.