OMAN MSM30 Elliott Wave Forecast
MSM30 Weekly chart
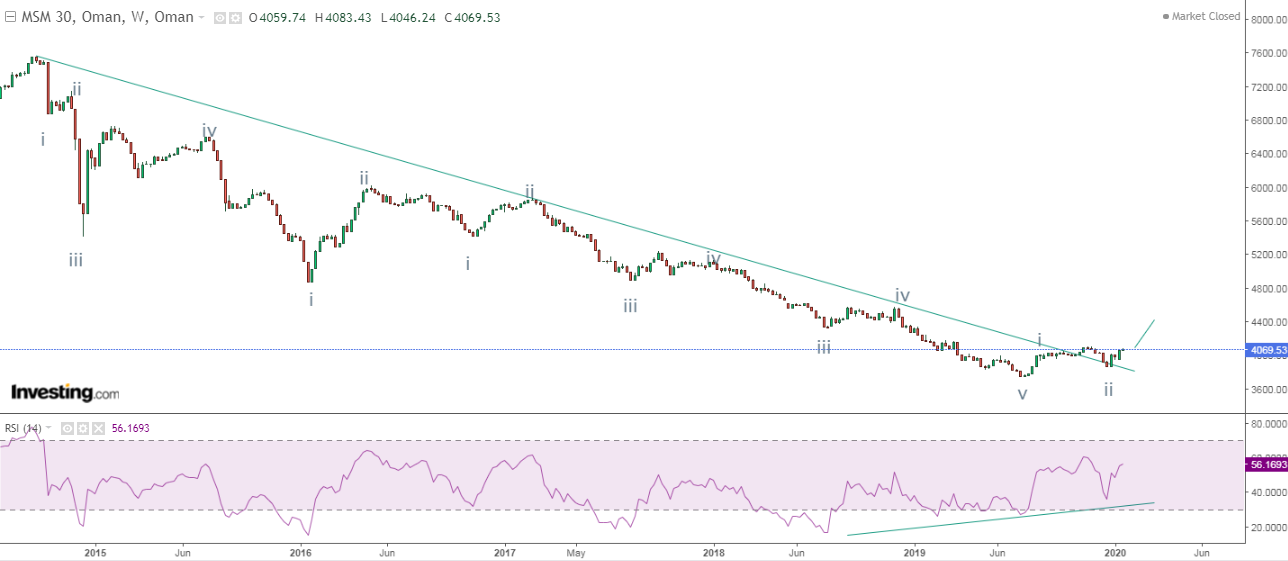
MSM30 is an index of OMAN and is all set to soar in coming weeks. This index is now positively poised and can move up dynamically after a bearish trend line break. At this juncture, prices are above the trend line even after the throwback. This means that a dip in price is also a buying opportunity. RSI on weekly chart has exhibited positive divergence which means that negative momentum is cooing off.
As per wave theory, prices have completed wave C in a five wave structure (i-ii-iii-iv-v) which means now there are high chances that prices will reverse. For short term I am expecting 4400 for this index to reach. Overall for long term perspective, prices can move up and start new leg after (a-b-c) pattern of wave 2 at one higher degree is done.
Learn Elliott wave and Neo wave in my 4 day webinar or classroom training. This course will teach you indepth analysis of how markets perform. The cost of the webinar/classroom training wil be Rs, 10500/- or $155. For inquiry call +919324174580.


Comments