Posts

Showing posts from August, 2014

EUR/INR Elliott Wave and Forecasting

Image
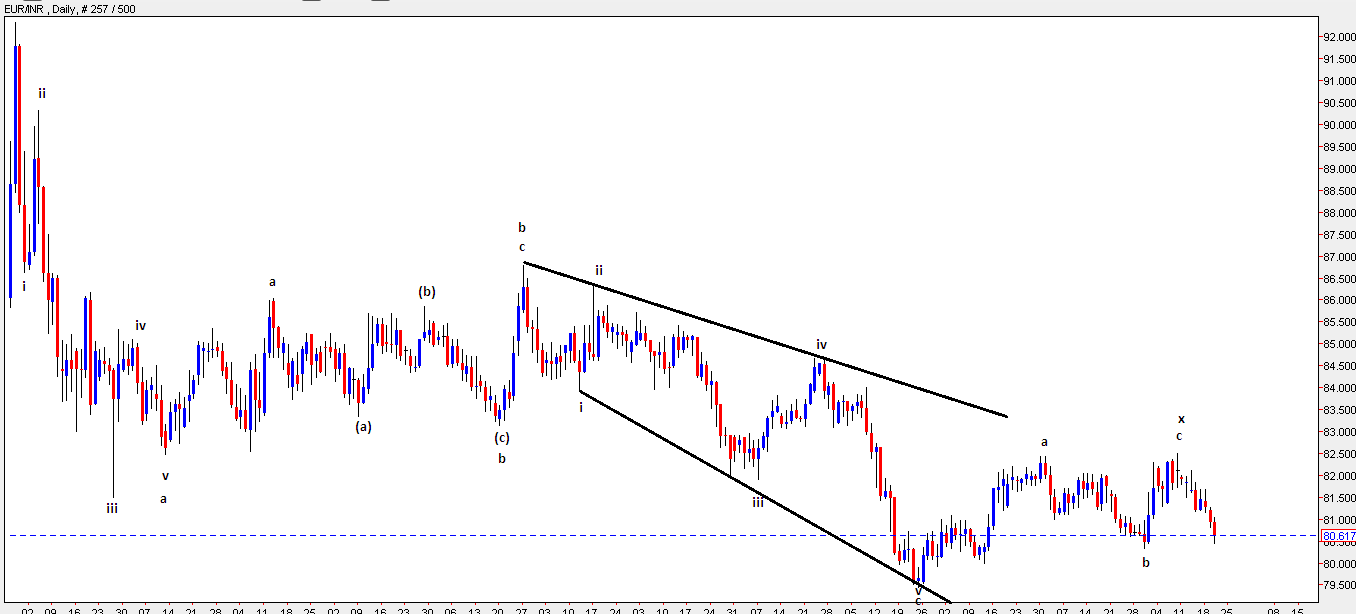
EURINR is moving down after making a high of 92.33 in the month of August 2013. We have shown you the next possible move for EURINR in our Elliott wave segment. From the below chart, prices is moving in a double corrective pattern, wave a was an impulse wave in which wave v was truncated followed by wave b which got completed at 86.78 in the month of January 2014, wave c was in a expanding diagonal pattern and was completed at 79.52 in the month of May 2014 and then it moved up and has completed wave x at 82.48 in the month of August 2014. Currently it is moving down in the form of wave a of the second correction, which means more two waves are pending. The current wave a can come down till 79.41 The bias for this pair is negative as it can test its previous pivot low of 79.41 in coming trading sessions.

CAC 40 (France): Termination of Triple correction (Elliott Wave)

Image
Paris CAC 40 has started its downtrend, as it is now moving down in a falling red channel, breaching previous lows but unable to cross its previous high which is a negative sign. After moving precisely in an upward sloping blue channel, prices eventually has given a bearish break thus accelerating selling pressure. From June 2012 till June 2014 prices has been moving in this channel, but now it is quoting below it which is the first negative sign. As per Wave theory, prices has completed triple correction pattern (a-b-c-x-a-b-c-x-a-b-c) and it has started its down move. The current fall seems to be impulsive and will move down steeply. Any rise in this index need to be utilized as a selling opportunity. In short, the bias for CAC 40 is firmly negative, expect this index to move down below 4000 levels in coming month or so. .

Hang Seng (Hong Kong)- To start the 3rd wave Anticipated Happened

Image
In our previous update as on 13th May 2014 we were expecting Hang Seng to move above 24000 which it did after crossing 24000 on 25th July 2014. The below paragraph was written on 13th May 2014 "Hang Seng was losing its gains after a significant up move from 21137 to 23224. The fall from 23224 to 21680 was a double correction pattern (a-b-c-x-a-b-c), prior to this fall the up move from 21137 to 23224 was a impulsive up move which we have counted wave i (marked on daily chart). Wave ii will be corrective in nature and it seems that wave ii got completed at 21680 levels as it has arrived till 76.2% retracement of the previous up move (21137-23224). Now Hang Seng will start picking up momentum and can move up till 24000 levels which is more than 100% of the previous wave i. This up move will start wave 3 which is strongest, longest and broadest. In short, our bias for Hang Seng is firmly positive as it can move up till 24000 levels in coming weeks." Anticipated on 13

GBPUSD - Triple correction on the way

Image
GBPUSD is moving in a positive direction by forming higher highs and higher lows which is a positive sign. In this entire rally from March 2013 to August 2014, prices have not breached its previous pivot low. Recently after making a high of 1.7190 which was 7 year high prices in July 2014 started eroding all the gains and moved below 1.6800 levels. The immediate pivot low is placed at 1.6698 levels which will play a crucial support for this pair. RSI is also in oversold zone and it is exhibiting positive divergence which indicates that the downtrend is exhausting and one should now be cautiously negative. From wave perspective, prices are moving in a triple correction pattern, which means there will be two wave x in between 3 corrective patterns (a-b-c-x-a-b-c-x-a-b-c). Prices ended its first correction in December 2013 and then it formed wave x at 1.5854 levels, then it moved up and completed second correction when wave c was in an ending diagonal pattern. Currently it is moving