Posts

Showing posts from April, 2022

Tata Chemicals: Elliott Wave Analysis

Image
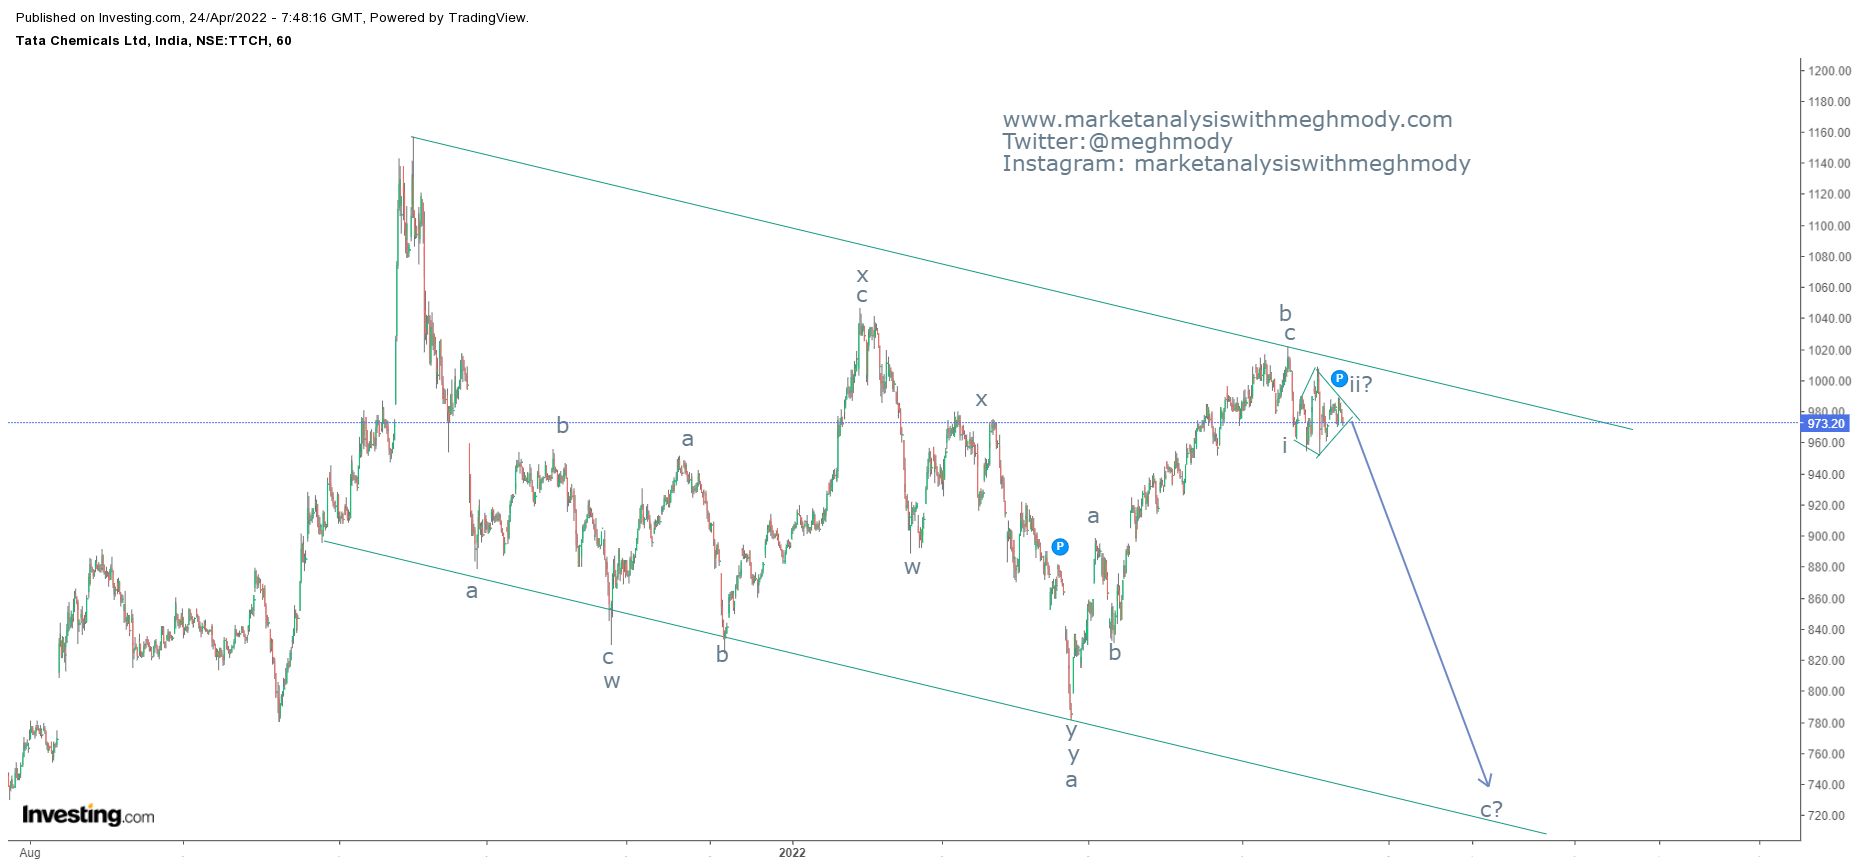
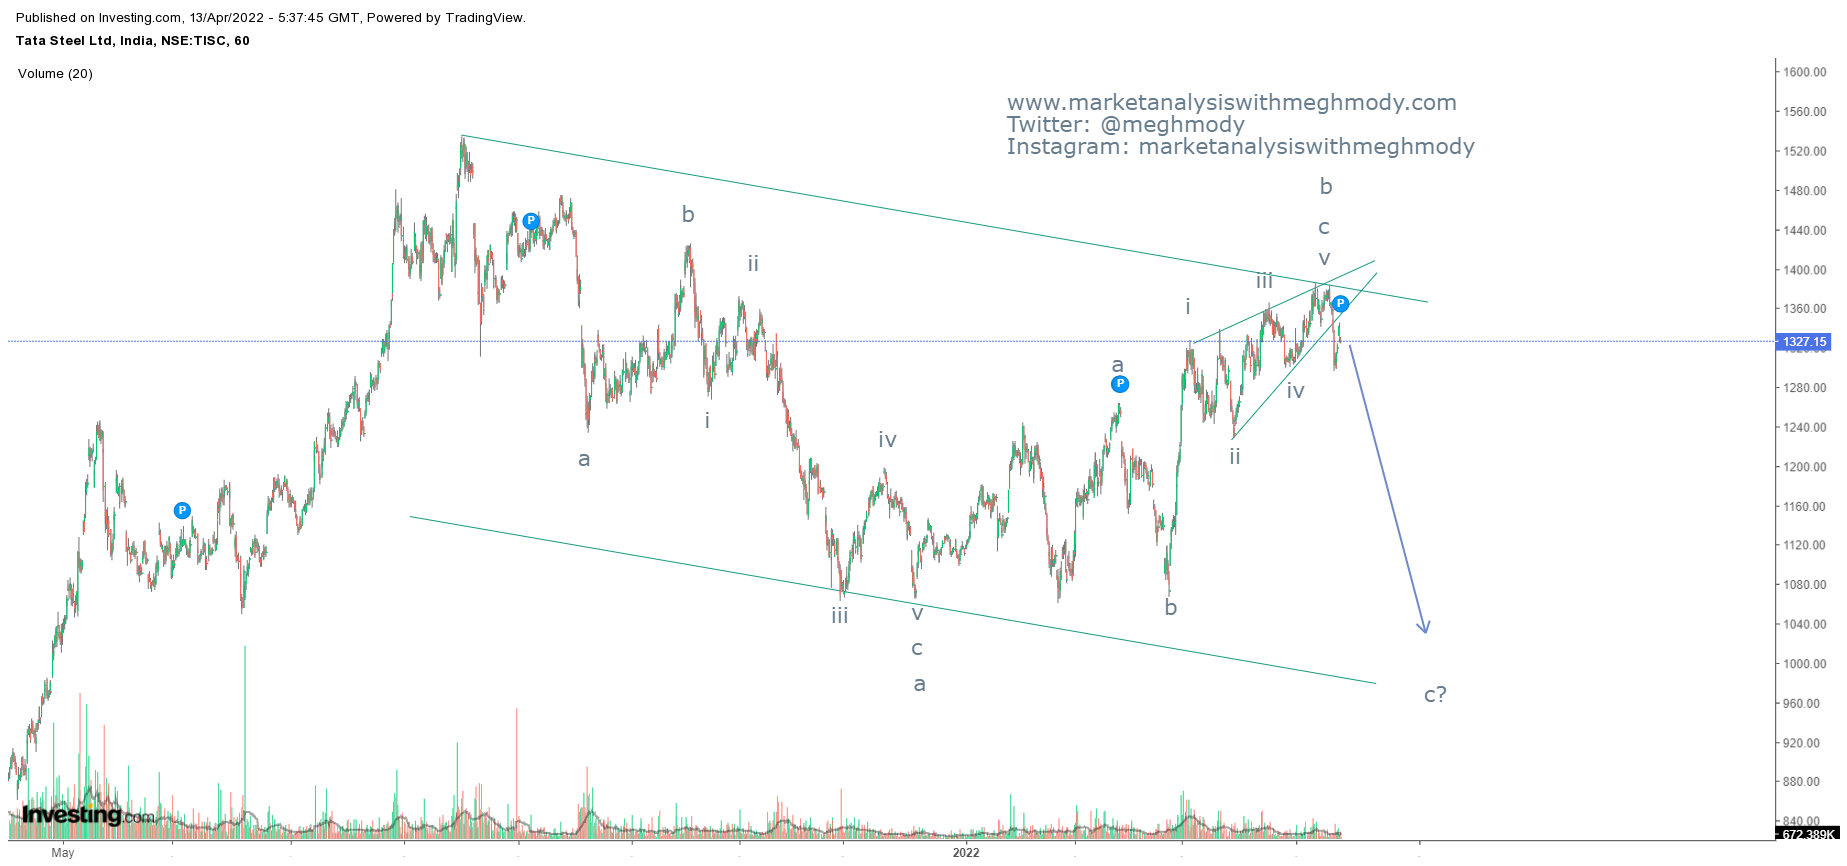
 Tata Chemicals 60 mins chart The above chart makes us understand that the trend is down as it is forming a lower highs and lower lows and moving precisely in a falling channel. Currently it is hovering near the resistance of the channel and soo there can be a reversal which can drag prices way lower. As per Elliott Wave, prices are moving in a corrective pattern (a-b-c) where wave a was a complex pattern and wave b was easier to identify and wave c is unfolding. This wave can lead prices to the level of 780-760 levels. The summation is Tata Chemicals is negatively poised and can falter till 780-760 levels over short to medium term.

Deepak Nitrite: Elliott Wave Analysis

Image
 Deepak Nitrite 60 mins chart Deepak Nitrite was one of the stocks which had given fabulous returns in past two years. However, it seems that the upside move is halted and profit booking can be seen. Prices after making an all time high of 3016 has dipped 1808 which is 40% from ATH also it has arrived now to crucial resistance of the falling channel and there are high chances that it can falter from here. With the help of Elliott Wave Analysis, prices are bound to plunge from current levels. As per Wave analysis, prices are moving in double correction (a-b-c-x-a-b-c) where it has completed wave x in a simple zigzag and wave a on the downside has started which can go till 1800 levels or even lower than that. The summation is Deepak Nitrite can sin to the level of 1800-1750 levels over short term with the resistance placed at 2400.

Hindalco: Bearish Head and Shoulder pattern and Elliott Wave Analysis

Image
 Hindalco 60 min chart As shown in the above chart, prices are moving in a lower highs and lower lows thereby breaking the rising trend line after forming a topping process or distribution process on the top. This distribution pattern is a well known pattern of traders known as Bearish Head and Shoulder pattern. The target of the pattern is the depth of the head and the right shoulder will act as a stoploss level. From Waves perspective, prices are either moving in wave a-b-c or what I have marked as impulse where wave iii is extended. Here wave iii of wave iii has started and it will continue to falter till the support of the falling channel. The summation is Hindalco is negatively poised and can plunge till 480-460 levels over short period of time.

Nifty: Anticipated Happened and Elliott Wave Analysis

Image
 Nifty 60 mins chart anticipated on 4th April 2022 Nifty 60 mins chart happened on 19th April 2022 In my previous update on Nifty dated 4th April 2022. I had mentioned that, " Nifty is set to reverse only a move below 17700 is broken which will infuse selling pressure dragging it towards 17000 over short term. However, move above 18160 will continue positivity." Nifty broken the small rising channel and also broke the crucial level of 17700 levels dragging it till 16830 levels - Anticipated Happened. To view my previous article on Nifty, click on the below mentioned link https://www.marketanalysiswithmeghmody.com/2022/04/nifty-anticipated-happened-and-road.html As per Wave analysis, prices are moving in a double correction where after completing wave x at 18090 levels, prices have opened wave a of second correction which can sink its previous low or can come close to its previous low level. However, I think the first correction of wave a is over where I have marked wave a? a

GBPINR: Triple Correction ongoing

Image
 GBPINR spot hourly chart In my previous update I had mentioned for GBPINR that, " GBPINR can test 99 levels but will reverse the direction to move back up till 102 levels over medium term." To view my previous article on GBPINR, click on the below link https://www.marketanalysiswithmeghmody.com/2022/03/gbpinr-anticipated-happened.html Prices plunged to 98.5 there by achieving my downside target of 99 but it is now on the brink to reverse as it can test the resistance of the falling channel- Anticipated happened As per Wave analysis, prices are moving in a Triple correction (a-b-c-x-a-b-c-x-a-b-c) where it has completed wave a of the third correction and it is all set to start wave b on the higher side which can move back up till 101.7-102 levels. The summation is GBPINR is set to bounce from the support of the channel and can test 101.7-102 levels over short period of time.

MCX Natural Gas: Elliott Impulse Wave

Image
 MCX Natural Gas daily chart As shown in the above chart, prices are moving up strongly despite of  RSI in overbought terrain, normally in this situation prices are drive by heavy demand and it is likely that it will stay higher over the course of time. From Waves perspective, NG is moving in wave 5 of an impulse which is likely to be extended and can move higher towards its next resistance of 630-650 levels where 261.8% of wave 1 to wave 4 is placed. The summation is MCX Natural Gas is bound to surge till 630-650 levels over short term.

MCX Crude Oil: Elliott Wave 5th Wave

Image
 MCX Crude Oil daily chart MCX Crude Oil is all set to rise again and can also move above its previous high as higher highs and higher lowers are intact. Secondly the shift in the angle has changed which can be verifies as it has broken the rising channel on the higher side. RSI has also relieved from the over bought terrain which is a positive sign. As per Wave Theory, prices have completed wave 4 in simple zigzag and it has started moving higher in the form of wave 5 of an impulse. Wave 1 was extended, wave 2 has not even moved below 38.2% of wave 1. Wave 3 is not 100% of wave 1 which opens the possibility that wave 3 will be shorter than wave 3. In this case, 5th wave can move up till 10000 -10200 levels over short term. The summation is MCX Crude Oil is positively poised and can move till 10,000-10,200 levels over short term

MCX Crude Oil: Revisited

Image
MCX Crude Oil 60 mins chart anticipated on 13th April 2022 MCX Crude Oil 60 mins chart happened on 14th April 2022 In my previous update on MCX Crude Oil I had mentioned that, " MCX Crude Oil is set to soar near till 7950-8000 levels over short term."  Prices after giving a bullish break continued to soar and achieved my mentioned level of 7950-8000 levels on following day - Anticipated Happened I had following the MCX Crude Oil chart and applied Elliott Wave on it and was highly successful in anticipating the fall along with the rise. To view my articles on MCX Crude Oil, click on the below link MCX Crude Oil Anticipated Happened https://www.marketanalysiswithmeghmody.com/2022/04/mcx-crude-anticipated-happened.html MCX Crude Oil: Simple Zigzag pattern https://www.marketanalysiswithmeghmody.com/2022/04/mcx-crude-oil-simple-zigzag-elliott.html As now the trend for the black gold is firmly positive, I will continue to monitor the prices of crude oil to understand if it is impul

MCX Crude: Anticipated Happened

Image
 MCX Crude Oil 60 mins chart anticipated on 1st April 2022 MCX Crude Oil 60 mins chart happened on 11th April 2022 In my previous update on MCX Crude Oil, I had mentioned that, " MCX Crude Oil can test the level of 7155 followed by 6620 levels over short term." I had given two targets in MCX Crude where the first one was achieved as it made a low of 7071 which was 61.8% of wave a to wave b. The second target was 161.8% of wave a to wave b where zigzags can be completed which it did not - Anticipated Happened To view my previous article on MCX Crude Oil, you can click on the below link https://www.marketanalysiswithmeghmody.com/2022/04/mcx-crude-oil-simple-zigzag-elliott.html Prices plunged by over 7.30% in 7 trading sessions and then bounced from cluster of supports breaking the falling trend line resistance and also the falling wedge pattern, both indicates that downtrend is over. As per wave theory, prices have completed wave a wave b and wave c in an ending diagonal patter

Tata Steel: Elliott Wave Analysis

Image
 Tata Steel 60 mins chart As shown in the above chart, prices are moving in a lower highs and lower lows and it is moving precisely in the falling channel. At current juncture, the stock is hovering near to the resistance of the falling channel and has also formed a rising wedge pattern.  From Waves perspective, prices have completed wave b and has unfolded wave c lower. In wave b, wave c of wave b is ending diagonal which was broken on 11th April 2022. As of now it is moving back up to test the resistance of the pattern. This concludes than wave c has started and can move down to test 1070 levels where cluster of supports are placed. The summation is Tata Steel is negatively poised and can plunge near till 1070 levels over short term.

Bank Nifty: Anticipated Happened and a reversal on cards?

Image
 Nifty Bank 60 mins chart anticipated on 2nd April 2022 Nifty Bank 60 mins chart happened on 3rd April 2022 In my previous update I had mentioned that, " Nifty Bank will continue to move higher close to 37500-37650 levels over very short term." To view my previous article on Nifty Bank click on the below link https://www.marketanalysiswithmeghmody.com/2022/04/bank-nifty-anticipated-happened-and.html The index crossed my level and also moved above the trend line resistance but failed to sustain above it, thus re-entering the falling channel. This opens negative possibilities for the the index. At present it is holding the trend line support, break of this level will infuse selling pressure and can drag prices way to lower. From waves perspective, prices have completed wave x  and will start double correction in this index (a-b-c-x-a-b-c). After completion of wave x, the index has started wave a which can move close to wave c of first correction. I am not in a rush to give bigg

Nifty: Anticipated Happened and road ahead with Elliott Wave

Image
 Nifty 60 mins chart anticipated on 9th March 2022 Nifty 60 mins chart happened on 4th April 2022 In my previous update I had mentioned that, "  I will continue to be positive for Nifty and it can move higher till 17600-17800 levels over short term." Nifty closed well above 18000 mark which has achieved my level of 17600-17800 levels - Anticipated Happened To view my previous article on Nifty, click on the below link https://www.marketanalysiswithmeghmody.com/2022/03/nifty-neo-wave-neutral-triangle-and.html Nifty has arrived near cluster of resistance marked by arrows also it is moving precisely in the rising channel which is steeper. This entire up move looks to be corrective but I am also opening  impulse wave as well, only a move above 18160 will open further positive possibilities. However, I still think that it will reverse from current levels and complete wave x. The summation is Nifty is set to reverse only a move below 17700 is broken which will infuse selling pressur

Bank Nifty: Anticipated Happened and Elliott Wave Analysis

Image
 Bank Nifty hourly chart anticipated on 9th March 2022 Bank Nifty hourly chart happened on 1st April 2022 In my previous update on Bank Nifty, I had mentioned, " Nifty Bank is positively poised and can move higher from current levels towards 37000-37300 over short term." On 1st April Nifty Bank made a high close to 37200 levels thereby achieving my above mentioned range/level - Anticipated Happened To view my previous article on Bank Nifty, click on the link below https://www.marketanalysiswithmeghmody.com/2022/03/bank-nifty-neo-wave-extracting-triangle.html The index after giving a bullish break in a small falling channel, it started moving higher in a higher highs and higher lows and also arriving near to crucial resistance of the big falling channel. I think prices can move tad higher from here to test the resistance zone. As per Wave theory, prices are moving in wave x, there is a high possibility prices will move close to 37500-37650 levels over very short term which wil

Nifty Metal Index: Anticipated Happened and Elliott Wave Forecasting

Image
 Nifty Metal Index daily chart anticipated on 20th March 2022 Nifty Metal Index daily chart happened on 29th March 2022 In my previous update I had mentioned for Nifty Metal Index that, " Nifty Metal Index is positively poised and can move towards 6570-6750 levels over short term." The index moved well above my first resistance of 6570 and made a high of 6620 levels thereby achieving my mentioned level - Anticipated Happened To view my previous update on Nifty Metal Index, click on the below mentioned link https://www.marketanalysiswithmeghmody.com/2022/03/nifty-metal-index-elliott-wave-anlysis.html As per Elliott Wave Analysis, prices are probably moving in wave iii or in wave iv which still opens wave v higher to complete wave c, once it is over prices will reverse back down. The level on the higher side can be 6750-6780 levels, but it will dip first somewhere close to 6330. The summation is Nifty Metal Index will dip close to 6330 levels and then will resume the major tren

MCX Crude Oil: Simple Zigzag Elliott Wave Analysis

Image
 MCX Crude Oil 60 mins chart Prices after moving up till 9990 levels on the back of ongoing conflict between Russia and Ukraine has now shown a relief. It looks like a major top is in place and the Crude Oil is set to plunge going ahead. As of now, prices failed to cross its previous high which discontinues higher highs. It is imperative to see if prices break its previous low.  Wave theory suggests, the commodity is moving in a simple zigzag pattern, where wave a is impulse followed by wave b which ended just below 61.8% and no wave c which looks to be impulse and can end up in between 61.8-161.8% of wave a to wave b. The summation is MCX Crude Oil can test the level of 7155 followed by 6620 levels over short term.

IDFC First: Elliott Wave Analysis

Image
 IDFC First 60 mins chart As shown in the above chart, prices are moving precisely in a falling channel and will continue to persists in this channel indicating that the trend will continue to be negative. Also the stock is moving in a lower highs and lower lows which support the above analysis. From Waves perspective, the stock is on the brink to complete wave C of a one corrective pattern (A-B-C). In wave C, the tricky part is whether it is completed or it is still ongoing as there is extension within extension seen. I have come up with the analysis that prices might re-test 36-35 odd levels in the form of last leg of wave C and then it will reverse (the above chart is self explanatory). The summation is IDFC First bank will face resistance at 42-3 levels forcing prices to re-test 36-35 levels over short term.

MCX Copper: Elliott Wave Analysis

Image
 MCX Copper continuous 60 mins chart From the above chart, MCX Copper is moving in a sideways direction, with the range becoming narrower going ahead. With this scenario one can possibly open triangle pattern. There is also another pattern in making which is bullish cup and handle pattern. The pattern will only be completed once it decisively breaks the level of 840. As per Elliott Wave, prices are either moving in wave ii or wave b at present. If the metal forms a triangle pattern then it will be clear that wave b has formed and wave c on the upside is pending. To form triangle, it will take time.  The other possibility is, prices will reverse and break 840 levels from here which will complete wave ii lower in the form of (w-x-y). In both the scenarios, the red metal is set to move higher, particularly above 840. The summation is MCX Copper needs to break 840 on the upside which can infuse additional buying soaring prices till 870-880 levels.