Posts

Showing posts from March, 2023

GBPINR: Ending Diagonal in making

Image
 GBPINR  5 hour chart Analysis From above chart, GBPINR continues to move in a higher highs and higher lows and has been consolidating above the falling channel. As far as prices are trading above the level of 00 the bias remains positive for the pair. RSI has also relieved from the overbought terrain and can move back up going ahead.   As per wave theory, the pair is moving in 5 th wave and can continue to move higher. I think that it will form an ending diagonal pattern which will make this pair move in a range of 102-103 levels and then the counter wave will start. The summation is GBPINR has limited upside left which can make this pair move in a range of 102-103 levels.

Nifty Anticipated Happened

Image
 Nifty daily chart Nifty 2 hour chart Analysis In my previous update I had mentioned that, " Nifty is expected to tumble now in the range of 17000-16800 over short term with the strong negative bias." The index made a low of16850 thereby achieving my level- Anticipated Happened To read my previous article on Nifty, click on the below link https://www.marketanalysiswithmeghmody.com/2023/03/nifty-elliott-wave_11.html As seen in the above daily chart, prices are moving precisely in a falling channel which is a negative sign. However, the index has arrived near to the support of the channel and it is likely that the benchmark can show signs of bounce back. ADX continues showcase that the downside strength is optimum. From 2 hour chart, prices are forming a reversal pattern at the bottom but as of now there is no price confirmation to it which makes this pattern not feasible. On the higher side the benchmark has a crucial resistance of 17305, if that is taken out then the entire p

Nifty Bank- Anticipated Happened

Image
 Nifty Bank daily chart Nifty Bank 2 hour chart Analysis In my previous update I had mentioned that, " Nifty Bank is negatively poised and can tumble towards 39600-39500 levels over short term. My medium term targets are still intact which I have mentioned in my earlier updates." The index tumbled well below the expected level and marked a low of 38598 levels. - Anticipated happened. To read my previous article on Nifty Bank, click on the below link https://www.marketanalysiswithmeghmody.com/2023/03/bank-nifty-wave-c-to-start.html As seen from the daily chart, prices are moving in a lower highs and lower lows but at current juncture, the index has arrived near to the support of the falling channel. However MACD continues to exhibit negative signal but on the short term time frame there are many reasons for not going further short. From 2 hour chart, prices are consolidating near to the support of the channel, also it is forming an inverse head and shoulder pattern near to thi

Punjab National Bank - Elliott Wave Counts

Image
 PNB 2 hour chart Analysis From the above chart, prices are moving in a lower highs and lower lows and is moving precisely in the falling channel. Recently it has arrived near to the support of the channel where the RSI has also been exhibiting positive divergence. As per Wave theory, the stock has completed wave a of one higher degree and has opened wave b in which the last leg of wave b which is wave c is pending on the higher side which can go till 50-51 levels. The summation is PNB can show a bounce back from the support levels towards 50-51 levels over short term.

Tata Motors last leg of the triangle

Image
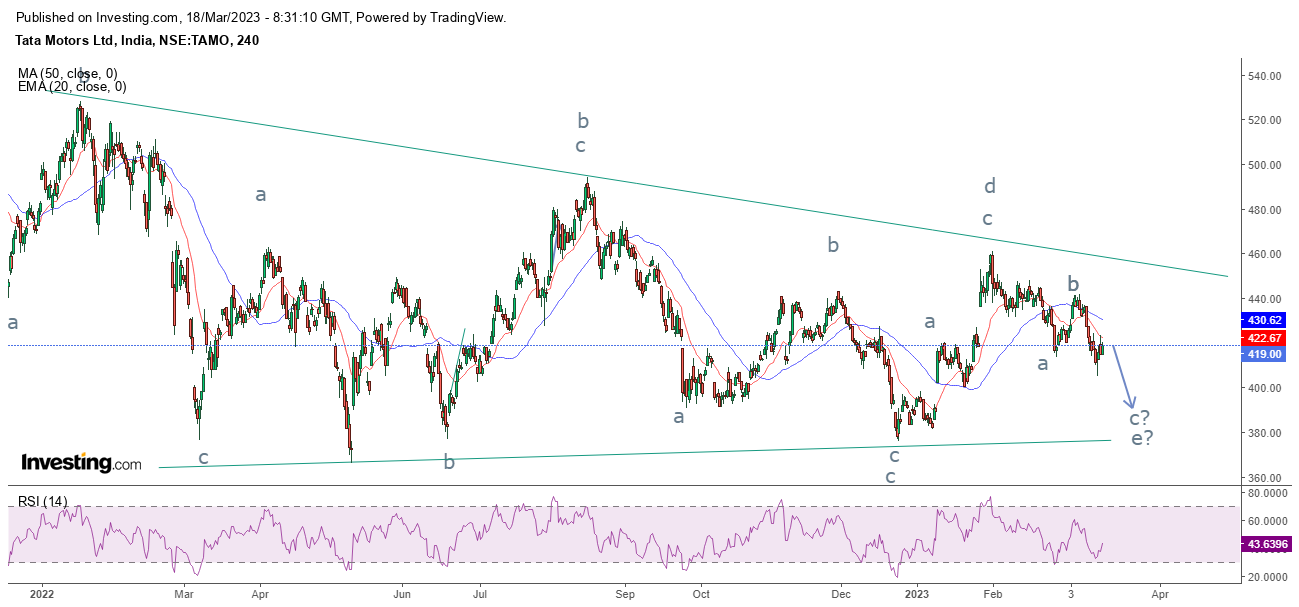
 Tata Motors 4 hour chart Analysis As seen in the above chart, prices are consolidating in a stiff range of 440-410 levels. As of now the stock has arrived near to the support of the range and can move higher from current levels. It seems that the stock might not move till 440 levels but can test 430 levels which will then make the stock plunge towards 400-390 levels. RSI is in oversold terrain and can relieve from this zone. Wave theory suggests, prices are moving in the last leg of the symmetrical triangle pattern where the current fall is likely to move towards 390 levels. It is also likely that prices might not test the lower trend line of the triangle which is a part of Neo Wave limiting triangle possibility as prior there are 4 touch points. The summation is Tata Motors might go up towards 420-430 levels and then eventually will move down till 400-390 price range.

Ethereum: 3rd Wave started

Image
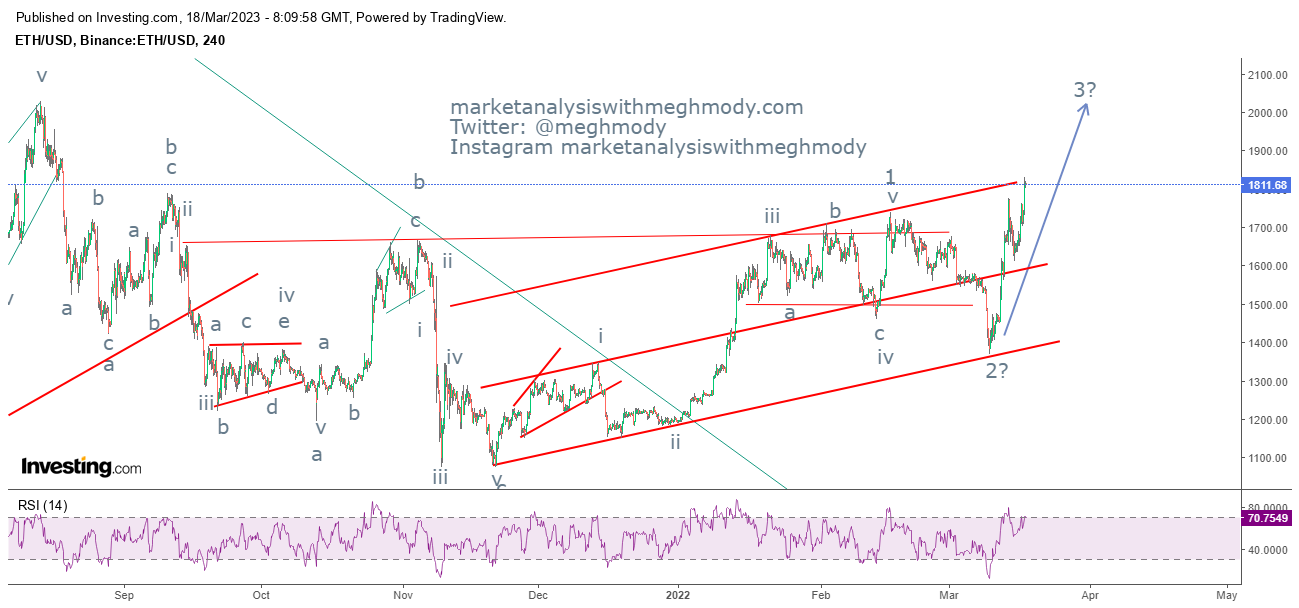
 ETH 4 hour chart Analysis As expected, prices have completed wave 2, though it tumble more than expected but eventually completed by forming a higher bottom and then crossing its previous high thereby confirming higher highs and higher lows and changing the trend from negative to positive. In my previous update I had mentioned that prices will complete wave 2 and wave 3 will open up, to read my previous article click on the below link https://www.marketanalysiswithmeghmody.com/2023/03/ethereum-wave-2-in-motion.html From Waves perspective, prices are moving in a rising channel and has started wave 3 higher which can go till $2000-$2200 levels over short term. The summation is ETH is likely to test the levels of $2000-$2200 levels over short to medium term.

EURINR- Sideways action expected

Image
 EURINR 2 hour chart Analysis As seen in the above chart, prices are moving in a sideways direction primarily in between 87-89 levels. Last week the pair plunged from the top of 88.60 and came back down towards 87 levels. It is not very obvious that it can go back up to test 88.50- 89 levels. According to Wave theory, prices are moving in a flat pattern where it has completed wave a followed by wave b lower which was the last week low and then trying to move higher in the form of wave c which can possibly be in an ending diagonal pattern. Another scenario can be, prices are moving in wave b of wave b as wave a was a steep fall so the current upmove can be wave b of wave b and then wave c on the lower side which can complete wave b then wave c higher. In both the above scenarios there is a high possibility for the pair to go higher towards 89 levels going ahead. The summation is EURINR has a crucial support of 87.00 on the lower side and can move higher to test 89.00 over short term.

Comex Gold: Wave 5 to extend

Image
 Comex Gold 4 hour chart Analysis Prices are moving in a higher highs and higher lows and has started moving higher. There are high chances for the yellow metal now to test its previous high of $2050 levels going ahead or can also move towards $2150 levels. From Waves perspective, prices are moving p in an impulse pattern where wave i and wave iii are equal, thereby opening the possibility of wave v to extend which can go till 100% from 0-3 wave added to wave iv. The 100% comes to $2150 levels going ahead. The summation is Comex Gold is positively poised and can move higher towards $2150 levels not immediately but gradually.

WTI- Double Correction

Image
 WTI 4 hour chart Analysis As seen in the above chart, WTI Crude oil prices were moving in a sideways action from past 3 months which was taken out on the lower side last week. RSI has also exhibited positive divergence indicating that downside is either over or on the brink to be. Last week I thought prices were moving in a triangle pattern where wave e was still pending and then the fall will strike. This was not the case as it happened to form a double correction in wave x and then it opened wave a which also looks to be double correction. Wave theory suggests that, prices are moving down in a falling channel and has started wave a post wave x which consumed more time between $82-$72. Break of this level has made the fall impulse which I think can be wave a or a part of wave a. In both the above case wave b can go higher which can test the level of $70-$72 in near term, that  can terminate wave b and then wave c lower. The summation is WTI Crude Oil has high chance to show resilienc

CAC40 - Wave C started

Image
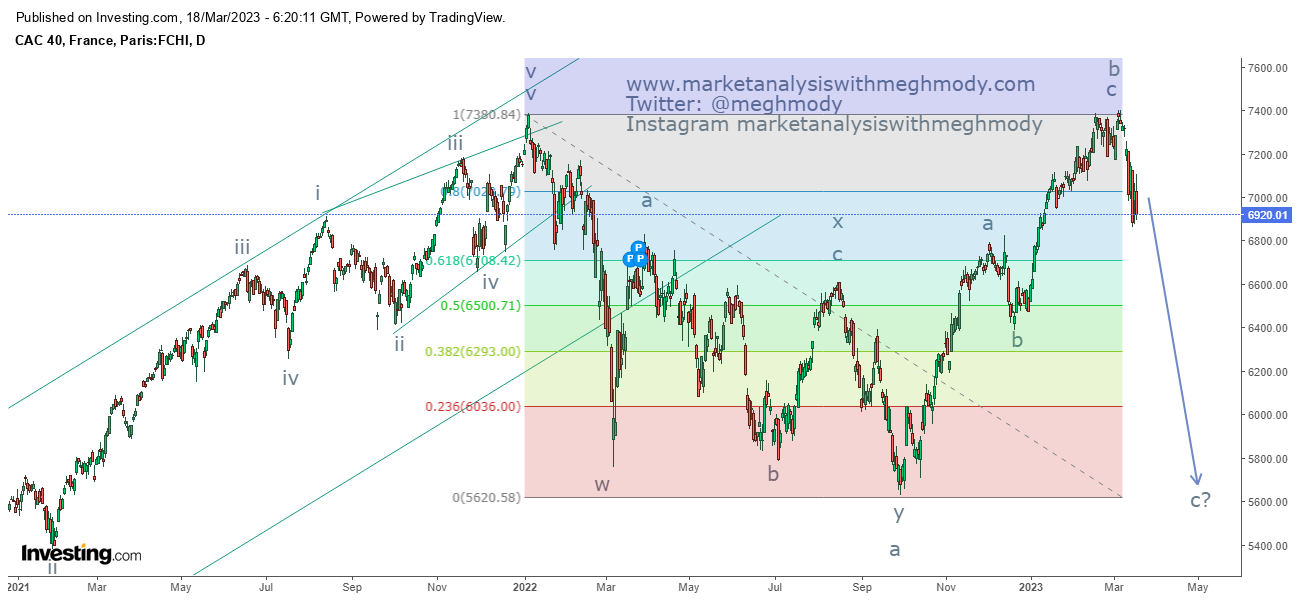
 CAC40 daily chart Analysis As seen in the above chart, prices faced the resistance of 7400 levels and started moving down thereby breaking the 0-b trendline. This clear indicates that the trend is showing signs of reversal. Also there is a high possibility for the index to plunge going ahead and test its previous low placed at 6000 followed by 5600 levels. From Wave perspective, the index is moving in a flat pattern (3-3-5), where it has completed wave a and wave b and has started wave c lower which can go till 6000 if incase wave c fails and can dip going ahead towards 5600 levels. The summation is CAC40 can dip going ahead in the range of 6000 followed by 5600 levels over short to medium term.

Nifty Elliott Wave

Image
 Nifty daily chart Nifty 2 hour chart Analysis In my previous update I had mentioned, " Nifty is likely to test the level of 17800-17900 price range over short term and then reverses from the resistance levels lower which I will update once I get confirmation." Nifty made a high of 17799 levels which was close to my mentioned level of 17800-17900 levels - Anticipated Happened To read my previous update on Nifty, click on the below mentioned link https://www.marketanalysiswithmeghmody.com/2023/03/nifty-elliott-wave.html From daily chart, the index faced the resistance of the falling channel and has started moving south. I had mentioned that it will eventually come down but will update once I get the confirmation. After giving the bearish crossover by the moving averages, prices are flirting with it but then it cannot sustain above it thereby shedding all the gains. Prices are negatively poised and are subject to falter going ahead. ADX has started picking up indicating that th

Bank Nifty: Wave C to start

Image
 Bank Nifty daily chart Bank Nifty 2 hour chart Analysis In my previous update I had mentioned that, "  Nifty Bank is positively poised over short term and can reach towards 41700-41800 levels." Prices made a high of 41659 which was close to my mentioned level. I you want to read the previous article on Bank Nifty, click on the below link https://www.marketanalysiswithmeghmody.com/2023/03/bank-nifty-alternate-counts-as-per.html As seen in the above daily chart, prices are moving in a lower highs and lower lows and it has faced multiple resistances of the falling channel along with the 50 SMA (blue) and has started moving down. The moving average continues to be negatively poised and prices are below both the moving averages which is not health for the index. In the weekly chart, prices have formed a dark cloud cover near the resistance of the channel (candlestick pattern). I have said  in my earlier update that first prices will go towards 41700-41800 levels and then it will

Bitcoin in expanding diagonal

Image
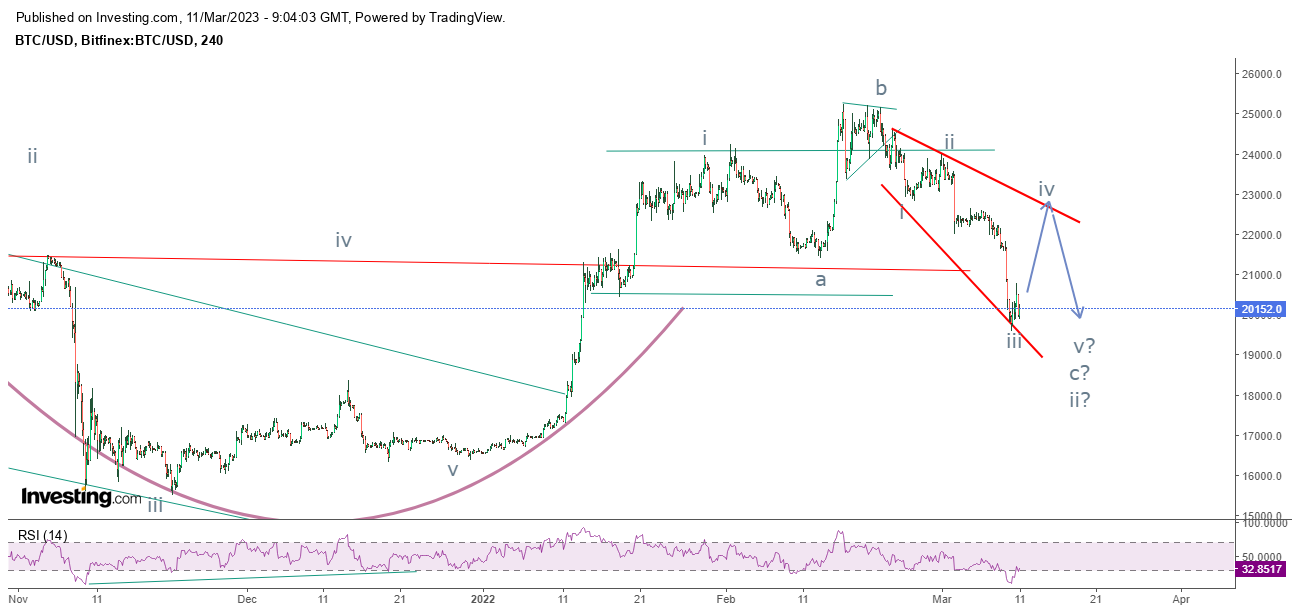
 Bitcoin 4 hour chart Analysis In my earlier update I had mentioned that BTC is moving in an ending diagonal pattern and I will continue to hold that view. However, instead of ending diagonal I think it has opened expanding diagonal and from current levels it is clear that the crypto can move back up towards $22900-$23000 levels. In expanding diagonal pattern, prices have completed wave iii and the internal structures looks corrective, this means it has opened wave iv on the higher side which can go towards the resistance of the red trend line (upper) inorder to overlap. As we are in the last leg of wave ii of one higher degree, there is a high possibility for a diagonal to occur which comes in wave c. The summation is BTC can move back up towards $22900-23000 levels over short term.

Comex Gold

Image
 Comex Gold 4 hour chart Analysis In my previous update, I had mentioned that Gold can tumble towards $1835-1830 levels which was successfully achieved - Anticipated Happened. Prices not only achieved my level but went down towards $1810 levels and from there it has come up back towards $1860 thereby completing one leg. From Wave theory perspective, prices have completed wave a on one higher degree and can start wave b on lower side which can test back again $1835-1825 levels. Once this move is done then it will open wave c on the higher side which can reclaim $1870-1890 levels. The summation is Comex gold can move down from current levels towards $1835-1825 levels over short term.

WTI Crude Oil - A symmetrical Triangle in making

Image
 WTI Crude Oil hourly chart Analysis It is visible from the above chart that prices are moving in a narrow range of $74-$80 and this range is narrowing going ahead thereby opening a symmetrical triangle pattern possibility. As of now there is a chance for the prices to move up from current levels back to test 80$. From Wave theory Analysis, prices are moving in a symmetrical triangle pattern where prices might have completed wave d on the lower side and it is opening wave e which is the last leg of the triangle pattern on the higher side. This wave can travel towards 80$ going ahead. The summation is WTI Crude can move towards 80$ if it is in the pattern mentioned above. However, failure to protect the level of $73 will negate the pattern.

Dow Jones - Impulse fall

Image
 DJIA Daily chart Analysis From the above chart, it is very clear that prices are moving now in a lower highs and lower lows and this gives a clear picture that the bias now remains negative. Last week the index crashed over Silicon Valley debacle and it seems that more pain is left.  MACD has shown a negative sign and continues to remain below the center line. As per Wave theory, prices have opened wave c lower after Wave b was completed at 34340 levels. Wave is currently ongoing is wave c in which prices have started moving down in wave iii which can travel till 31200-31100 levels and then a counter move towards 31700 to form wave iv and finally wave v which can go till 30800 levels. The summation is Dow Jones can move down towards 31200-31100 over short term and over medium term it can reach till 30800 mark.

GBPINR - Wave 5 to start?

Image
 GBPINR 4 hour chart Analysis As seen in the above chart, prices are moving in a higher highs and higher lows showing strength. Within this trend, there is a smaller trend which is moving in a falling channel. Recently prices have picked momentum from the lower end of the channel, thereby showing resilience. RSI is in overbought zone and ROC which is in the lower panel has crossed the center line and entered in the positive terrain. In my previous report I had mentioned that it is possibly moving in a triangle pattern, which was negated but the view remained the same on the positive side. From Waves perspective, the pair is moving in wave 4 and might have completed it as it retraced 61.8% of wave 3 and has not even overlapped wave 2 terrain. It has opened wave 5, where wave i of wave 5 is over and wave ii which is the counter wave can drag prices towards 98-97.80 price range which will be a buying opportunity. Once wave ii will be over, the pair can move higher towards its next resista

Nifty Elliott Wave

Image
 Nifty daily chart Nifty 2 hour chart Analysis From the above chart, Nifty is moving precisely in the falling channel and has bounced from the lower end of the channel. There is a high possibility for the index to reach towards the resistance of the channel from current levels and can test the 50 sma (blue) which is near to the zone. ADX has also started picking strength. As shown in the 2 hour chart, the index is moving facing the resistance of the short term moving average 50 sma, there is high chance that it crosses this resistance zone and move higher from here. On the higher side the index can test the levels of 17800-17900 levels over short term. As per Wave thoery, there are two scenarios which I have opened The first scenario is prices are moving in a-b-c-x-a-b-c where it has completed wave a and has opened wave b higher after completing wave x. The other scenario is prices are moving in wave 1 in leading diagonal where it has completed wave 1 and has opened wave 2 higher  foll

Bank Nifty - Alternate Counts as per Elliott Wave

Image
 Bank Nifty daily chart Bank Nifty 2 hour chart Analysis As seen in the above daily chart, prices are moving in a lower highs and lower lows fashion and precisely moving in a falling trend line. Recently the index found the support of the lower trend line of the channel and bounced back thereby opening positive possibilities. There is a high possibility for the index to move close to the higher end of the channel. From 2 hour chart, prices have crossed both the short term moving averages and they have given a bullish crossover thereby opening positive possibilities. Prices are expected to reach towards 41700-41800 price range over short term. According to Wave theory, prices are moving in (a-b-c) pattern but i am opening another alternate wave count. The first possibility id (a-b-c-x-a-b-c) where after wave x prices have completed wave a and now going up in the form of wave b higher. The other possibility is as shown in the daily chart, is the first correction towards 39000 is wave A a

Adani Port- Elliott Wave Analysis

Image
 Adani Port daily chart Analysis As seen in the above chart, prices are showing strength from the bottom after Hidenburg report. Prices are suppose to comeback and reach towards its crucial resistance first at 720 levels . RSI has also some room to travel back into overbought terrain.  Wave thoery suggest, that prices are coming up in wave a where there is some more vacuum left which can take towards 80% of the wave c of the previous corrrection placed at 720 levels. Once this leg will be over prices will open corrective wave back in form of wave b and then eventually wave c on the higher side. The summation is Adani Port can move higher towards 720 levels over short term. 

Tata Power - Simple Zigzag pattern

Image
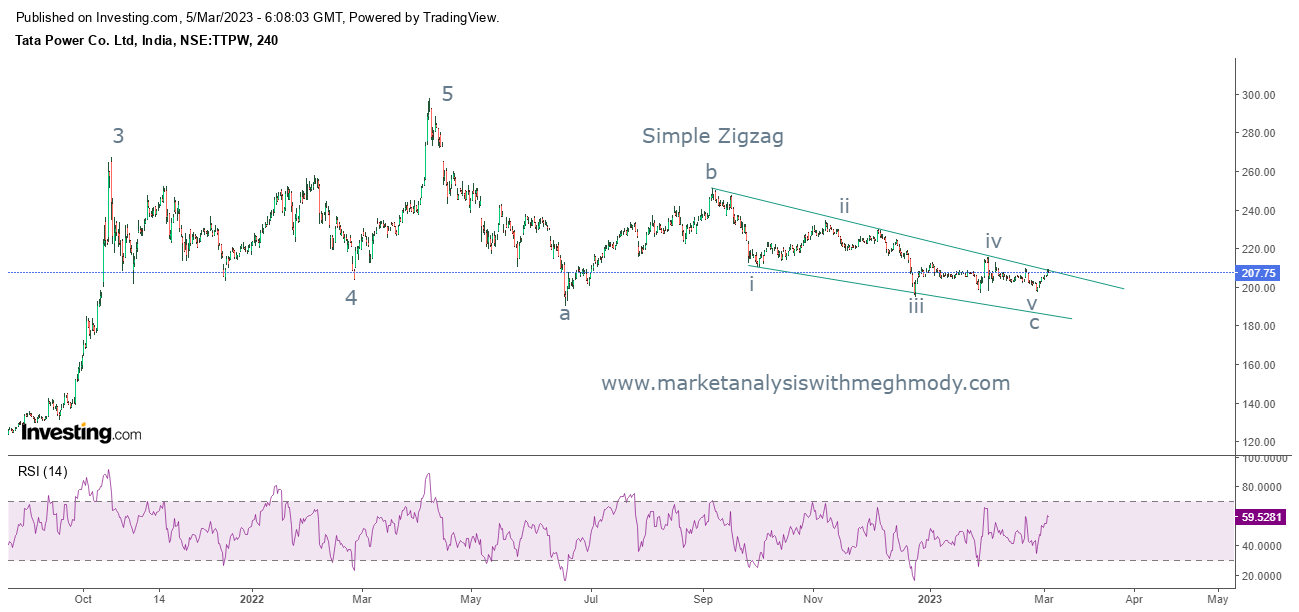
 Tata Power 4 hour chart Analysis After forming a top of near to 300 levels, prices corrected and fell in a lower highs and lower lows fashion. However, it has arrived near to its previous low of 190 levels from where it has shown a sign of resilience. The stock is moving in a stiff range of 211-190 levels and it is imperative for the price to break this range for a trending move to emerge. From Waves perspective, prices have completed simple zigzag pattern from the top, where wave b was below 61.8% of wave a and wave c was near to 61.8% from wave a to wave b. Now it is important for the stock to sustain above 211 levels which will open another leg on the higher side till the start of the ending diagonal pattern of wave c. The summation is Tata Power needs to break above 211 levels which will open positive possibilities soaring prices towards 236-240 price range.

WTI Crude Oil

Image
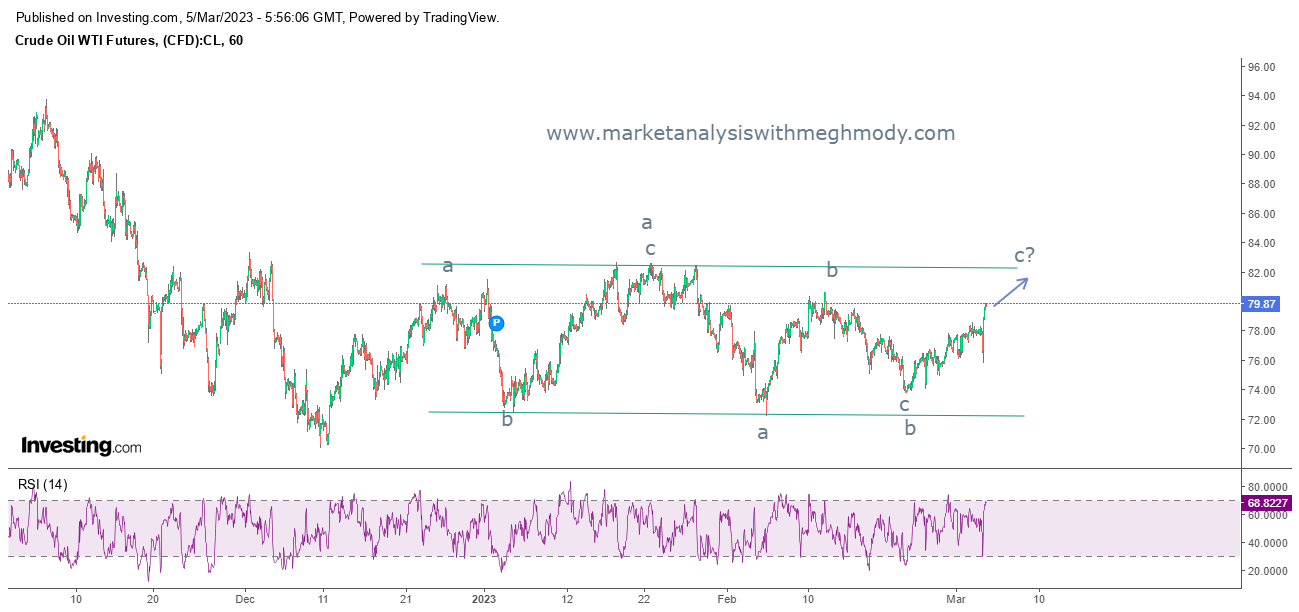
 WTI Crude Oil hourly chart Analysis As seen in the above chart, prices are moving in a range of $72-82 levels. Recently it has bounced from the lower end of the range and it is now inching towards the higher end of the range placed at $82 levels. At present it is trading at $80 and can move up towards $82 in coming week. From Waves perspective, prices are moving in (a-b-c) and it is likely to be a flat pattern, where wave c can go above the end of wave a. Prices are positively poised and can test $82 in couple of days. The summation is WTI Crude can test $82 levels with support at $78.8 levels over very short term.

Ethereum: Wave 2 in motion

Image
 ETH 240 mins chart Analysis Ethereum is still consolidating in a range of $1500-1700 levels, as far as price persists in this range, sideways action  can be seen. However, one thing is clear that prices are suppose to give a bullish break going ahead. As per Wave thoery, prices are moving in wave 2, in which either wave a is in motion or the entire structure will terminate in simple zigzag pattern. Internal counts are still tricky but $1500 will act as a crucial support for this crypto coin. The summation is ETH will consolidate in a range of $1500-1700 for time bieng, after that $2000 -2200 is likely to be seen over medium term.

Bitcoin one last leg down

Image
 Bitcoin 240 mins chart Analysis As expected last week Bitcoin continued to move in a range of $22000-23000 levels. As of now prices are moving down with very less pace and possibly making a bullish reversal pattern. This pattern is still in making and cannot go below $21000. The falling wedge pattern will continue to make price move in the above mentioned range. From Waves perspective, prices are moving in wave ii in which it completed wave a and wave b in triangle pattern. Wave c of wave ii is still ongoing which is possibly in ending diagonal pattern, which once complete will open wave iii higher. The summation is Bitcoin will continue to move in a range of $22000-23000 levels with support of $21000 placed. Once this down leg is done it will then achieve the level of $28000 followed by $33300 levels.

Hang Seng Anticipated happened

Image
 Hang Seng daily chart anticipated on 13th Feb 2023 Hang Seng daily chart happened on 27th Feb 2023 Analysis In my previous update I had mentioned that, " Hang Seng is unlikely to go below 19600 and can consolidate in the range of 22760-19600 levels over the time." The index did not go below 19600 and made a low of 19745 levels and reversed from that level as expected - Anticipated Happened. To view my previous article on Hang Send, click on the below link https://www.marketanalysiswithmeghmody.com/2023/02/hang-seng-elliott-wave-analysis.html As seen in the above chart, prices had taken the support of the falling trend line which was acting as a resistance prior (role reversal). From there it has started picking up positive momentum and it is now likely to move towards its next resistance zone. Wave thoery suggests, the index has completed wave ii and it is now opening wave iii on the higher side which can travel minimum towards 100% of the wave i to wave ii place at 27690 le

USDINR Antcipated Happened

Image
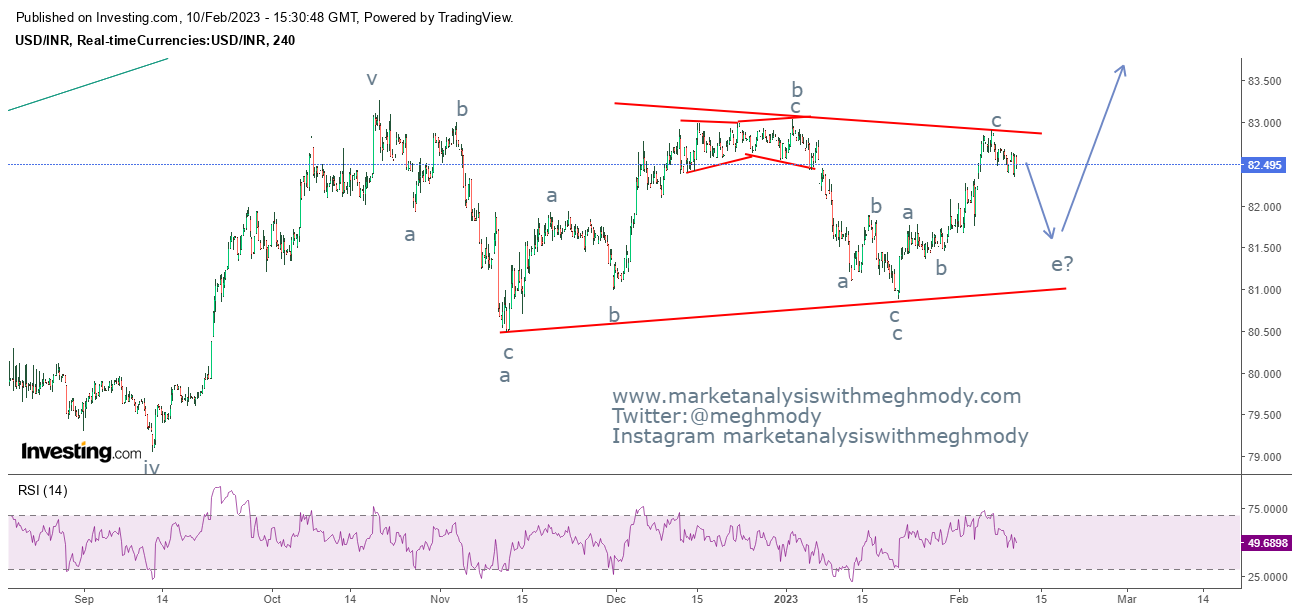
 USDINR 240 mins chart anticipated on 13th Feb 2023 USDINR 240 mins chart happened on 3rd Mar 2023 Analysis In my previous update dated 13th Feb 2023, I had mentioned that USDINR will move below 82 levels when it was near to 83 levels. " USDINR can fall below 82 in coming weeks which can drag prices close to 81.80-81.60 price zone over short term." The pair sinked below 82 levels and marked a low of 81.89 and it is likely that it will mark a new low on Monday morning thereby achieving my mentioned level. To read my previous update, click on the below mentioned link https://www.marketanalysiswithmeghmody.com/2023/02/usdinr-anticipated-happened-and-elliott.html As seen in the above chart, prices are moving in an ascending triangle pattern which was identified ahead of time and market participants. It is likely that the pair is on the brink to complete this pattern and now will open its next move soon. Traditionally triangle can act as a reversal pattern or it can be a continuat