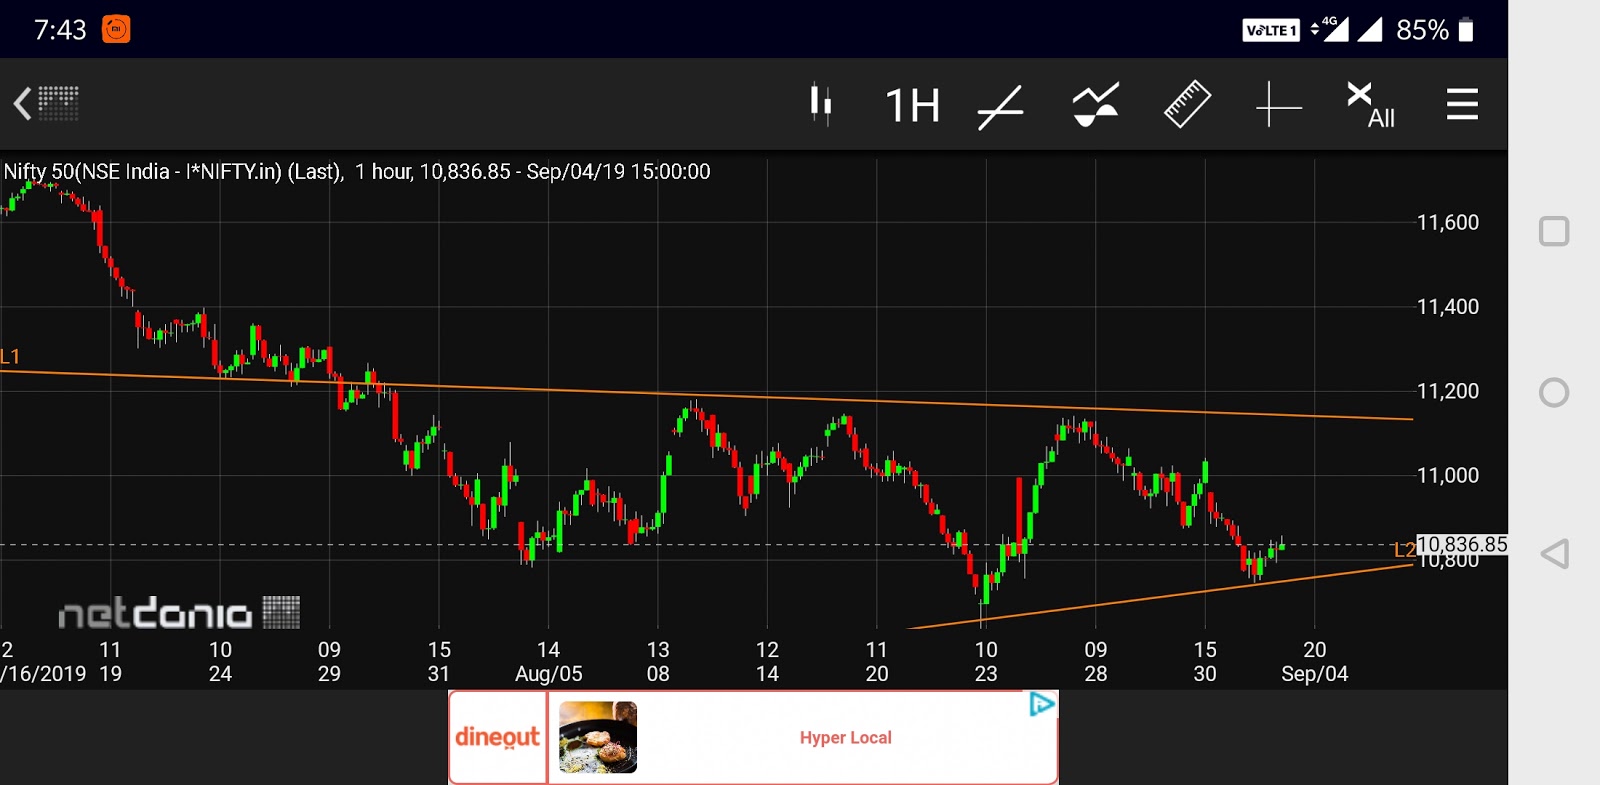
In the above hourly chart, a two converging trend lines are drawn in which prices are moving within, giving an indication that symmetrical triangle is forming. In a triangle pattern the requirement is, there needs to be two touch points on both the trend lines. In this case the requirement is fulfilled. From waves perspective, a triangle needs to have five legs within (a-b-c-d-e). All the waves in the pattern is corrective in nature. In the above case wave d is completed and wave e has opened, this wave e is not may or may not touch the lower trend line. So I expect that prices should fall in a range of 9700-9600 levels where wave e will complete. After completing wave e lower which will also complete wave b on one higher degree. Prices are expected to start wave c higher which can be 61.8% or 100% of wave a of one higher degree. So prices can move till 13390 and or 15780 respectively. The summation of the above chart is, the bias for Bitcoin is firmly positive. The Cry