US 10-2 year yield spread chart
Daily chart
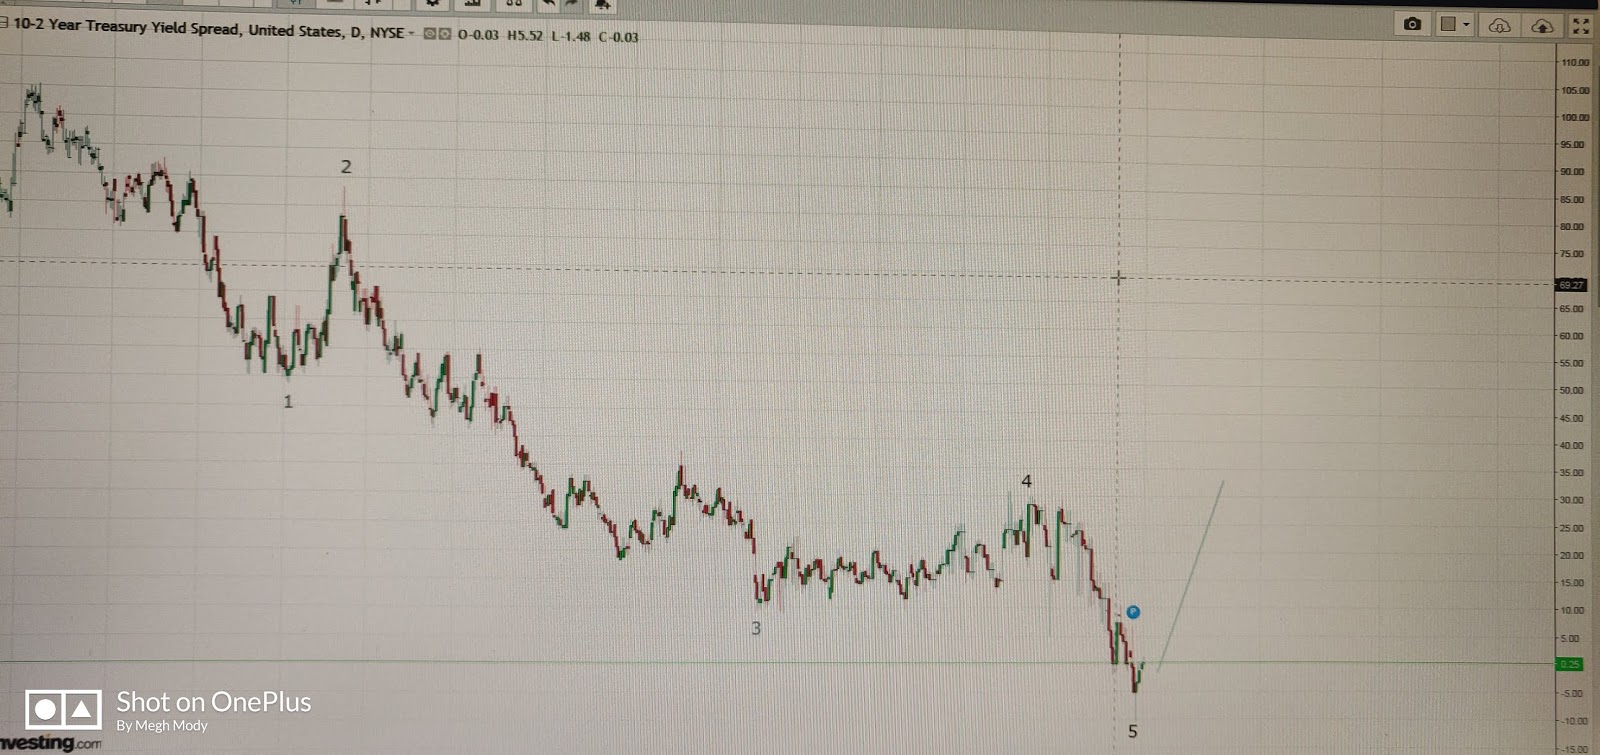
From the above chart we all can see that the yield curve has gone below zero this making it inverted. It is making an effort to remain above zero at present.
If the yield curve moves below zero, it means slowdown or recession is nearing. If this happens Reserve Banks from across the globe will start quantitative easing so that they can bring back the economy back to normal. Now ECB meet is lined up along with FED. This will give enormous hint in coming days.
I have place manual wave counts where I see that the asset class has moved down in a 5 wave structure. Once the five wave is done it reverses.


Comments