Posts

Showing posts from April, 2023

Nifty Bank Elliott Wave

Image
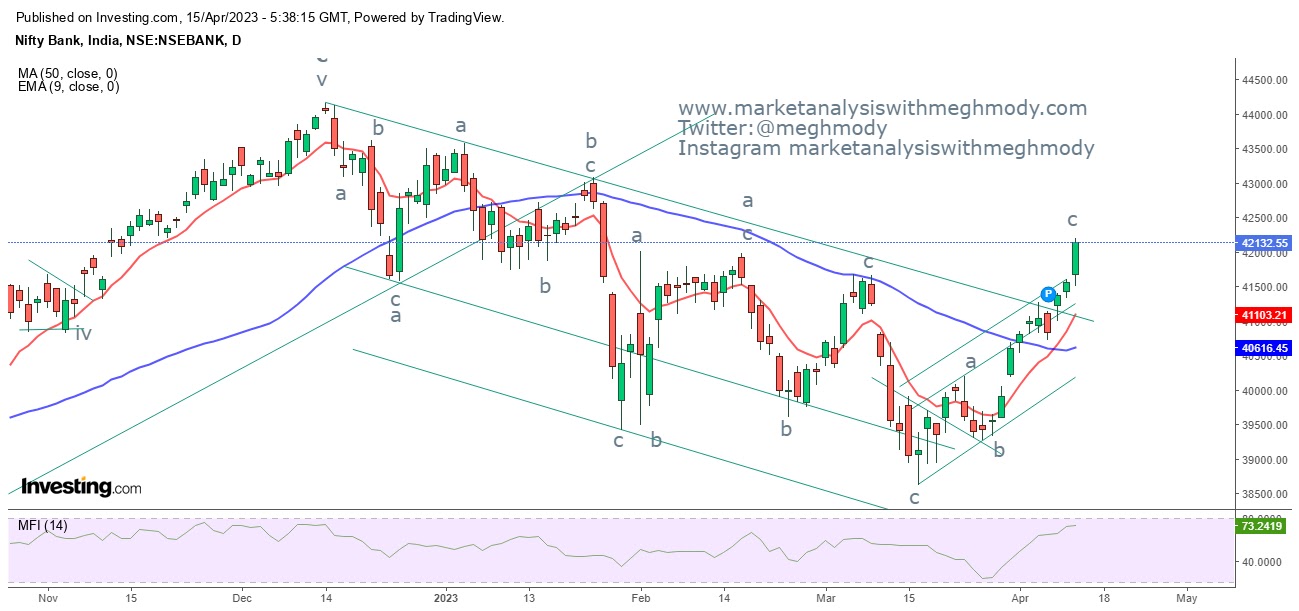
 Nifty Bank daily chart Nifty Bank 2 hour chart Analysis As expected in Nifty Bank, prices crossed 42,350 levels and reached my mentioned level of 42,700 levels - Anticipated Happened From daily chart, the index is moving in a rising channel and it is moving precisely in this positive formation. As of now there is no reversal seen but most of the oscillators are in overbought and can possibly remain in overbought terrain going ahead while price continue to soar. The index has crossed 80% of the previous fall 44,150 -38,610 levels. and there is a possibility for the index to climb towards 100% also. As seen in the 2 hour chart, the index is taking support of 20 EMA (red) which is a sign to figure the potential support of the index. The moment it fluctuates to and fro it will give an indication of a top being placed. At current juncture there is no sign of this and so prices are expected to move higher from current levels. Wave theory suggests that prices are moving in wave B in which it

Nifty Elliott Wave Forecast

Image
 Nifty daily chart Nifty 4 hour chart Analysis In my previous update, I had mentioned that Nifty can open positive possibilities once the level of 17660 is breached decisively which can soar index price towards 18,000-18,100 levels. After breaking the above mentioned level the index made a high of 18,089 levels thereby achieving my mentioned range - Anticipated Happened. As seen in the above daily chart, the index has moved past 18,000 levels with RSI in overbought terrain. Also it is arriving near to crucial resistance of 18,165 levels where the February high was made. All these factors pin point that Nifty can shown signs of reversal.  From 4 hour chart, prices are moving in a higher highs and higher lows but RSI is in extremely overbought terrain. Not only that lower time frames are well above 80 levels indicating there is not enough vacuum for the index to travel higher.  Elliott Wave theory suggests that, prices are moving in wave c of wave b which is the last leg. Also five waves

Ethereum and Wave Counts

Image
 Ethereum 4 hour chart Analysis As seen in the above chart, prices made a high of more than $2100 levels and faltered thereafter to travel back below $2000 levels. The crypto has a strong support placed at $1700 which is likely to be tested in some time. According to Wave theory, prices are moving in wave 3 in which it has completed wave i and it is moving in wave ii where one minor leg is pending on the downside which can test $1700 levels. After that wave iii of wave 3 will start which can soar till $2400-2600 levels. The summation is ETH is moving in a positive direction but can test $1700 levels before surging towards $2400-2600 levels. Join my Telegram Channel :  https://t.me/elliottician1 Join My Twitter handle :  https://twitter.com/meghmody? s=11&t=LtKvFYlMyQs71k-udwEPgQ

WTI Crude Oil and Elliott Wave Analysis

Image
 WTI Crude Oil 4 hour chart Analysis As seen in the above chart, prices broke the crucial support of $74.90 and tumbled further towards $73.80 levels. It seems that prices are moving in a positive formation as it is moving precisely in a rising red channel. Within this red channel, prices corrected from the highs of $85 till $73.80 levels in a falling channel as seen in the above chart.  There are cluster of supports near to this levels, first is the red channel support. Second is 61.8% of wave iii. Third the territory of wave i where wave iv cant overlap. RSI has also exhibited positive divergence indicating that the downfall is over or on the brink to complete. From Waves perspective, prices are on the verge to complete wave iv in a zigzag pattern and retraced 61.8% of wave iii. There is a high possibility for the price to bounce from current levels towards $85.00-$85.50 levels over short term. The summation is WTI Crude Oil can move higher towards $85.00-85.50, once the level of $76

Hang Seng Elliott Wave Analysis

Image
 Hang Seng Daily chart Analysis As shown in the above chart, the index is consolidating near to the support of the falling trend line from many months. Also it is in the process to form the right shoulder of the inverse head and shoulder pattern. Any reversal from current levels which is 19900 can show a positive momentum towards 23000 levels followed by 25000. Wave theory suggests that, prices are moving in wave ii of wave iii and can open wave iii of wave iii higher which can go till 23000 levels. Also 0-ii trend line is intact which can make wave iii extended. The summation is Hang Seng is positively poised and can move higher towards 23000 followed by 25000 over short to medium term. Join my Telegram Channel :  https://t.me/elliottician1 Join My Twitter handle :  https://twitter.com/meghmody? s=11&t=LtKvFYlMyQs71k-udwEPgQ

Comex Silver and Elliott Wave Counts

Image
 Comex Silver 4 hour chart Analysis As seen in the above chart, prices are moving in a higher highs and higher lows which is a positive formation. However, at current juncture, the silver prices are consolidating within the levels of $25.80-$24.80 levels. Prices are also consolidating after the bullish breakout as shown in the above chart. The consolidation is happening on the support of the trend line which was earlier acting as a resistance (role reversal). There are high chances that prices can go higher towards $27.00 - $27.55 levels over short term. From Waves perspective, prices are moving in a descending triangle pattern of wave iii/c in which it has made wave iv in descending triangle pattern. This means wave v on the higher side is pending which can travel towards $27 plus levels which will then complete wave iii. The summation is Comex Silver is positively poised and can soar towards $27.00-$27.55 levels over short term. Join my Telegram Channel :  https://t.me/elliottician1

GBPINR Expanding Diagonal and Post Impact

Image
GBPINR 5 hour chart   Analysis  As seen in the above chart, prices are moving in a sideways action with the range narrowing in between 102.30-101.80 levels. As far as prices are moving in this range, no trending move is expected. This narrowing range opens the possibility of a triangle pattern which is expected to complete once the extreme moves mentioned above is taken out. From Waves perspective, prices are moving in a corrective pattern (a-b-c) where it moved down from the highs of 102.92 and made a low of 101.26, where wave a was completed, followed by wave b which is in process of making a symmetrical triangle pattern (a-b-c-d-e) and then wave c lower which can falter in the range of 100.50-100.00 levels. The summation is GBPINR is negatively poised and can plunge in the range of 100.50-100.00 levels over short term. Join my Telegram Channel :  https://t.me/elliottician1 Join My Twitter handle :  https://twitter.com/meghmody? s=11&t=LtKvFYlMyQs71k-udwEPgQ

Comex Gold and the 5th leg

Image
 Comex Gold 4 hour chart Analysis As seen in the above chart, prices continue to climb higher with the major trend being positive. The yellow metal is now closer to its potent support of $1950, if broken will change the trend from positive to negative. Failure to do so will continue the upward trend. Prices made a high of $2048 before faltering towards $1970 this has made RSI to plunge near to its oversold terrain. There is a high possibility now that prices might start climbing back and surpass $2048 levels over short term. From Waves perspective, the yellow metal is moving in the last leg which is wave v, seeing the characteristic of the recent up move, gold is forming an ending diagonal or expanding diagonal. I firmly think that wave ii of wave v is over and wave iii higher will start which can surge prices towards $2050-$2060 levels. In this entire up move, wave i, wave iii and possibly wave v will be equal, if it will be equal then wave v which is forming an ending or expanding di

Nifty Elliott Wave Analysis

Image
 Nifty daily chart Nifty 2 hour chart Analysis In my previous update we had mentioned that Nifty need to cross 17,750 fir further positive possibilities which can soar prices towards 17,900 levels. The index made a high of 17,842 levels. I will continue to hold my level of 17,900 levels going ahead. Also to read my previous update on Nifty, click on the below mentioned link https://www.marketanalysiswithmeghmody.com/2023/04/nifty-elliott-wave-analysis.html As seen in the daily chart, prices have crossed the hindrance of 17,750 and closed well above it thereby giving a positive breakout. The moving averages are on the brink to give a bullish crossover, as of now the index is above the averages which is a positive sign. From 2 hour chart, prices are in oversold terrain and has started exhibiting negative divergence which is a sign of caution. There is a high possibility that the index will retest the level of 17,800-17,700 levels which will be a good level to enter the markets.  Wave the

Bank Nifty: Elliott Wave Analysis

Image
 Bank Nifty daily chart Bank Nifty 2 hour chart Analysis In my previous update I had mentioned that Bank Nifty is positively poised and can move higher. Any move above 41,350 will open further positive possibilities. However, break of 40,650 will change the trend. The index crossed the level of 41,350 levels which soar the price till 42,193 levels - Anticipated Happened. To view my previous update on Bank Nifty, click on the below mentioned link. https://www.marketanalysiswithmeghmody.com/2023/04/nifty-bank-elliott-wave-analysis_8.html As seen in the above daily chart, prices are above both the moving averages and the short term moving average 20 EMA (red) has crossed the medium term moving average 50 SMA (blue) thereby opening bullish crossover, this has happened after January 2023 where bearish crossover happened. From 2 hour chart, prices are moving in a higher highs and higher lows and can move higher as there is a bullish break in a falling channel pattern. There is a possibility

WTI Crude and Elliott Wave Counts

Image
 WTI Crude 4 hour chart Analysis In my previous update I was of the opinion that WTI Crude Oil price will come down in the range of $77.70-$76.00 and then will achieve the level of $82 followed by $84. The Oil price could not go lower as expected but moved higher towards $83.60 levels. To read my previous article on WTI Crude, click on the below mentioned link https://www.marketanalysiswithmeghmody.com/2023/04/wti-and-elliott-counts.html As seen in the above chart, prices failed to close the rising gap where the bullish breakout happened, I think this gap has come in between the rally and if not filled it can continue to go higher. This gap can be named as a runaway gap and the target of the rally comes to $91.00. I had mentioned the level of $88.00 in my earlier update as well which can be a crucial resistance and possibly an intermediated topping formation. From Waves perspective, prices are moving in wave iii of wave iii and can surpass $84.00 and can make an attempt towards $85.00.

Comex Gold: Elliott Wave Analysis

Image
 Comex Gold 4 hour chart Analysis In my previous updates on Gold, I have been telling that it might move in the range of $2100-$2150 levels. This seems a little challenging for the yellow metal as it can move towards $2100 but difficult to surpass it.  As per Wave analysis, prices are moving in wave v, in wave v wave i and wave iii are equal. Initially I believed that wave v of wave v will be extended but there is another guideline which says that all the impulse waves can be equal which is wave i-iii-v. In wave v of wave v, I think ending diagonal is in motion in which iv of wave v of wave v is ongoing. Any move near to $2020-$2005 will terminate wave iv of wave v of wave v which will ten unfold wave v of wave v of wave v which can also be throw over (going above the trend line of the ending diagonal. The 100% comes to $2080 levels which is close to my level of $2100-$2150. So I will continue to hold my level of $2100 over short term. The summation is Comex Gold can stumble in the lev

FTSE 100 : Elliott Wave Analysis

Image
 FTSE100 daily chart Analysis As seen in the above chart, prices are moving in a higher highs and higher lows. Recently prices were correcting and made a low of 7,309 levels and could not break its previous low of 6,707 levels which makes the positive formation intact. At present, the index is moving higher and there is a high possibility that it will cross its previous high of 8,058 levels. From Waves perspective, the index is moving in wave v and it is very clear that it will form an ending or expanding diagonal. I will stick to the former pattern and currently it is going higher in wave iii of wave v and will cross 8,058 levels. The summation is FTSE100 is likely to move higher towards 8,050-8,100 levels over short term. Join my Telegram Channel :  https://t.me/elliottician1 Join My Twitter handle :  https://twitter.com/meghmody? s=11&t=LtKvFYlMyQs71k-udwEPgQ

Ethereum: Anticipated Happened

Image
 ETH 4 hour chart anticipated on 1st April 2023 ETH 4 hour chart happened on 14th April 2023  Analysis I was continuously of the opinion and has timely mentioned in my update that ETH is expected to reach towards $2000-$2200 levels which has happened as it has entered the price range mentioned by me - Anticipated happened To read my previous update on Ethereum, click on the below mentioned link https://www.marketanalysiswithmeghmody.com/2023/04/ethereum-elliott-wave-analysis.html From Waves perspective, prices have opened wave 3 which if extended can go till 161.8% or even 261.8% from wave 1 to wave 2. In the above case, prices have achieved 100% so now it can go till 161.8% which is placed at $2400-2450 levels. The summation is Ethereum can travel higher going ahead and can enter in the range of $2400-$2450 levels over short term. Join my Telegram Channel :  https://t.me/elliottician1 Join My Twitter handle :  https://twitter.com/meghmody? s=11&t=LtKvFYlMyQs71k-udwEPgQ

USDINR: A bullish reversal pattern in an Ascending Triangle Pattern

Image
 USDINR daily chart (spot) USDINR 4 hour chart (spot) Analysis From a month I have been saying that USDINR is likely to move higher cross series of resistances which is at 83.00 and reach towards 85.00 levels. First we all need to understand that prices are moving in an impulse fashion where it is currently moving in wave 4 which is your ascending triangle pattern. Currently the pair is in the last leg of this pattern and probably it might have finished wave e of the triangle pattern which will open wave 5 higher anytime soon. From Daily chart, prices are consolidating in a range of 81.00-83.00 levels from past 6 months and it is very important for prices to give a trending move by breaking this range on either side. My view continues to be positive for the pair. Also RSI has arrived near to the oversold terrain which is suggesting that there is no room for the pair to go down. As shown in 4 hour chart, the pair is moving in a ascending triangle pattern, where it is in the final leg. A

Bitcoin: Elliott Wave

Image
 Bitcoin 4 hour chart Analysis From last many times I was of the opinion that Bitcoin will reach towards $28000 followed by $33000-33200 levels. Prices reached my first target and it is very much likely it will achieve my second target of $33000-33200 levels over the time. As of now it is consolidating in the range of $28760-26700 levels. Prices are likely to remain in this range but if it moves above $28760 then there can be resumption of uptrend which can soar prices towards $33000-33200 levels. The target of inverse hand and shoulder pattern comes to $35000.  From waves perspective, prices are moving in wave iii and can move higher towards $33000-33200 levels. The summation is Bitcoin is positively poised and can reach to $33000. Any dip can be utilised as a buying opportunity.

Nifty Bank Elliott Wave Analysis

Image
 Nifty Bank daily chart Nifty Bank 2 hour chart anticipated on 3rd April 2023 Nifty Bank 2 hour hart happened on 6th April 2023 Analysis As mentioned in my previous update,  Nifty Bank is positively poised and can move higher towards 41200-41400 levels over short term. Nifty Bank made a high of 41242 thereby achieving my level of 41200-41400 - Anticipated Happened To view my previous update, click on the below mentioned link https://www.marketanalysiswithmeghmody.com/2023/04/nifty-bank-elliott-wave-analysis.html As shown in the above daily chart, the benchmark has arrived near to the resistance of the channel and has formed an advance bloc (candlestick pattern) near the resistance. There needs to be a confirmation which can only be obtained if there is a red / black candle on the following day. However, any move above 41350 will open further positive possibilities for the index. From 2 hour chart, prices are moving higher with the moving averages supporting the index in a positive way.

Nifty Elliott Wave Analysis

Image
 Nifty daily chart Nifty 2 hour chart anticipated on 3rd April 2023 Nifty 2 hour chart happened on 6th April 2023 In my previous update I had mentioned that, " Nifty is positively poised and can move higher towards the level of 17550-17600 levels over short term." The index moved higher towards my price range of 17550-17600 levels by marking a high above 17600 up by 1.50% in the previous week - Anticipated Happened. To view my previous update, click on the below mentioned link https://www.marketanalysiswithmeghmody.com/2023/04/nifty-elliott-wave-counts.html As seen in the above daily chart, the index has arrived near to its resistance of the falling channel. Now if Nifty wants to move higher it is important for the index to give a decisive break above 17750 levels, thereby giving a bullish break in the falling channel formation. From 2 hour chart, Nifty is closing in to the resistance and ROC over short time frame is exhibiting negative divergence. However, price confirmation

Taiwan Weighted Elliott Wave Counts

Image
 Taiwan Weighted Daily chart Analysis From the above chart, prices which were moving in a falling channel has started moving higher by forming higher highs and higher lows. Along with that, the index ahs also formed an inverse head and shoulder pattern which has given a bullish breakout thereby opening positive possibilities. The target of the pattern comes to 17,800 levels. Currently prices are trading at crucial support level of the rising channel. As per Wave theory, the index is moving in either impulse or corrective fashion. The current characteristic feels like the third wave is extended and wave i and wave ii of the iii is over and wave iii on the higher side is unfolding. The summation is Taiwan Weighted is expected to test 16,400 levels from current levels over short term.

GBPINR: Expanding Diagonal In Wave 5?

Image
 GBPINR 5 hour chart Analysis As shown in the above chart, prices are moving in an expanding wedge pattern which gives an indication that there is a limited upside seen in this pair. Also RSI is exhibiting negative divergence supporting my view that upside is capped.  Wave theory suggests that, prices are moving in wave 5 and in this wave there are high chances of ending or expanding diagonal to form. In this case prices are forming expanding diagonal pattern. Within this pattern wave iii is over and wave iv will move down towards 101.40-101.20 range which will end wave iv and then last leg which is wave v of wave 5 will open surpassing 103.00 levels. The summation is GBPINR can be bought around 101.40-101.20 levels for the resistance placed at 103.00 levels.

WTI and Elliott Counts

Image
 WTI 4 hour chart Analysis As seen in the above chart, prices which were moving in a falling channel, opened with a gap up after OPEC+ committed to cut the Crude Output. After a gap up opening on last Monday, prices not only broke the falling channel formation but also have reversed the trend of the Crude Oil prices. But looking at the current structure, prices are in highly overbought terrain and can relieve from current levels which can give additional vacuum to prices to climb back higher. As per Wave theory, I was wrong in opening Double correction pattern and instead I opened Wave A of on higher degree lower and opened Wave B of one higher degree higher. At present it is moving in wave a of wave B and can move higher but minutely if you see, there is a high chance it can dip close to $77.50 levels before climbing back up. However any move above $82 levels will make the price reach till 84 levels followed by $88 levels. The summation is if WTI Crude Oil prices dip towards $77.70-$7

Comex Gold

Image
 Comex Gold 4 hour chart Analysis In my previous update I had mentioned that Comex Gold is positively poised and can move higher from current levels towards $2100-$2150. Prices crossed the level of $ 2000 last week and made a high of $2030 and it is arriving near to my mentioned level of $2100-2150 levels. To view the previous update, click on the below mentioned link. https://www.marketanalysiswithmeghmody.com/2023/04/comex-gold-elliott-wave-analysis.html Prices have arrived near to the resistance of the rising channel along with the horizontal line placed at the top. At current juncture it is early to say that if prices have made the top or it is just a correction from where it fell from. As far as there is no discontinuation of higher highs and higher lows the bias remains positive. However, RSI has started exhibiting negative divergence which is a sign of caution. From Waves perspective, prices are moving in wave v after completing the symmetrical triangle pattern in wave iv. Any m

Nifty Bank Elliott Wave Analysis

Image
 Nifty Bank daily chart Nifty Bank 2 hour chart Analysis In my previous update I had mentioned that  Nifty Bank is expected to move higher from current levels with possibility of a gap down move on Monday. On the upside it can move up till 39900-40100 levels. Any move above 41000 will push prices way higher till 41700-41900 levels. Prices in the daily chart have crossed its previous swing high thereby opening positive possibilities. Also the index has crossed its 20 EMA (red) which was acting as a crucial resistance. At present  the index is facing the resistance of 50 SMA which has also been very crucial. MACD is positively poised and can move higher from current levels. From 2 hour chart, the index has crossed its previous high with a gap up thereby opening positive possibilities. The index can now move close to the resistance of the channel which is placed at 41200-41400 price range. The summation is Nifty Bank is positively poised and can move higher towards 41200-41400 levels over

Nifty Elliott Wave Counts

Image
 Nifty daily chart Nifty 2 hour chart Analysis In my previous update I had mentioned that once the level of 17305 is taken out, a bottom is in place and prices will rise back.  Last week the index moved above 17305 and closed strong on Friday which will now make the index move in the range of 17400-17600 levels as mentioned in my previous update. To read my previous update on Nifty, click on the below mentioned link https://www.marketanalysiswithmeghmody.com/2023/03/nifty-anticipated-happened.html As seen on the above daily chart, the index is moving in a falling channel has has picked up momentum from the lower end of the channel. A gap up opening was seen last week which was un-filled making it as a breakaway gap and thereby opening a directional move in the index. The index has also crossed its previous high which is the first time happening in past 4 months, thereby opening positive possibilities. RSI has also started moving higher and crossed the center line. In the weekly chart,

Ethereum Elliott Wave Analysis

Image
 ETH 4 hour chart Analysis After making wave 2 at $1372 levels, prices continues to move higher till $1855 levels post that ETH is consolidating in a stiff range of $1850-1700 levels. As far as prices persists in this range the bias will be sideways. This does not mean that the target of $2000- $2200 is negated. The level is bound to achieve but will consume time. Prices are moving in wave iii where it has completed wave i of wave iii and currently is it moving in wave ii o wave iii which can move down towards $1750-1720 levels which will be the last leg of wave ii of wave iii, post that it will again move higher in the form of wave iii of wave iii. The summation is ETH can move back down towards $1750-1720 levels which can be utilized as a buying opportunity for the level of $2000-$2200 levels. Join my Telegram Channel :  https://t.me/elliottician1

Comex Gold: Elliott Wave Analysis

Image
 Comex Gold 4 hour chart Analysis In my previous update I had mentioned that,   Comex Gold is positively poised and can move higher towards $2150 levels not immediately but gradually" Gold eventually is on the verge to move higher and it will to achieve the above level. I will continue to be positive for the yellow metal. To view my previous article on Comex Gold, click on the below link https://www.marketanalysiswithmeghmody.com/2023/03/comex-gold-wave-5-to-extend.html Another update I had written where I opened for all time high for gold in early January mentioning for the level of $2100 https://www.marketanalysiswithmeghmody.com/2023/01/comex-gold-elliott-wave-aanlysis.html As seen in the above chart, prices are moving in a higher highs and higher lows and currently forming a sideways consolidation pattern namely triangle pattern. Triangles can be a continuation and reversal pattern, but in this case it will be a continuation pattern. From Waves perspective, prices are moving i

WTI Crude Oil - Elliott Wave Analysis

Image
 WTI Crude Oil 4 hour chart WTI Crude Oil 1 hour chart Analysis From the above chart, prices are moving in a lower highs and lower lows fashion. At present, prices are arriving near to the resistance of the falling channel and there it is forming a rising wedge pattern. This pattern gives a bearish breakout which will open negative possibilities from the resistance. RSI is also near to the overbought terrain and it is exhibiting negative divergence. As per Wave theory, from hourly chart, Crude oil prices are moving in wave b after wave a was over at $64.42. From there it is moving up in a corrective structure. Currently it is moving in the last leg of the pattern which is ending diagonal. In this pattern wave iv and wave v is pending which might take couple of days and once this is completed, there are high chances for the price to reverse which will start wave c lower towards $66-$64 levels. The summation is WTI Crude Oil price is likely to sink towards $66-$64 levels, for this target

Nasdaq: Elliott Wave Analysis

Image
 Nasdaq 2 hour chart Analysis As seen from the above chart, prices were moving in a lower highs and lower lows and was moving in  a falling dotted channel, once this was taken out (bullish breakout), the index made an attempt to re-test the falling channel which was earlier acting as a support. At present, the index is on the verge to cross its previous high which will change the trend from negative to positive and will move in a rising channel formation as showcased in the above chart (red). Elliott Wave suggests, Nasdaq has opened wave c higher, in which it has completed wave i and wave ii and now wave iii is ongoing which can move till 12600-12660 levels (minimum) and (maximum) it can go till 161.8% which isp placed at 13100 levels. The summation is Nasdaq can move till 12600-12660 levels, a sustainable move above this level will open further positive possibilities towards 13000-13100 levels.

EURINR: A Flat Pattern

Image
 EURINR 2 hour chart Analysis As seen in the above chart, EURINR was precisely moving in a rising green channel which was broken on Friday. There are high chances that the pair will open with a gap down on Monday and will move down thereby breaking the 89.00 levels. From Waves perspective, prices are moving in a flat pattern (3-3-5) where in it has completed wave A and Wave B and unfolded wave C. In wave C it has completed wave i and wave ii and has started wave iii which can go till 86.70 levels which is 161.8% from wave i to wave ii. As per the pattern there are high chances for the price to retrace all of wave B in the ongoing wave which is placed at 86.00 levels. The summation is over the short term EURINR can stumble towards 86.70 levels and over the medium term it can move till or below 86.00 levels.