WTI Crude and Elliott Wave Counts
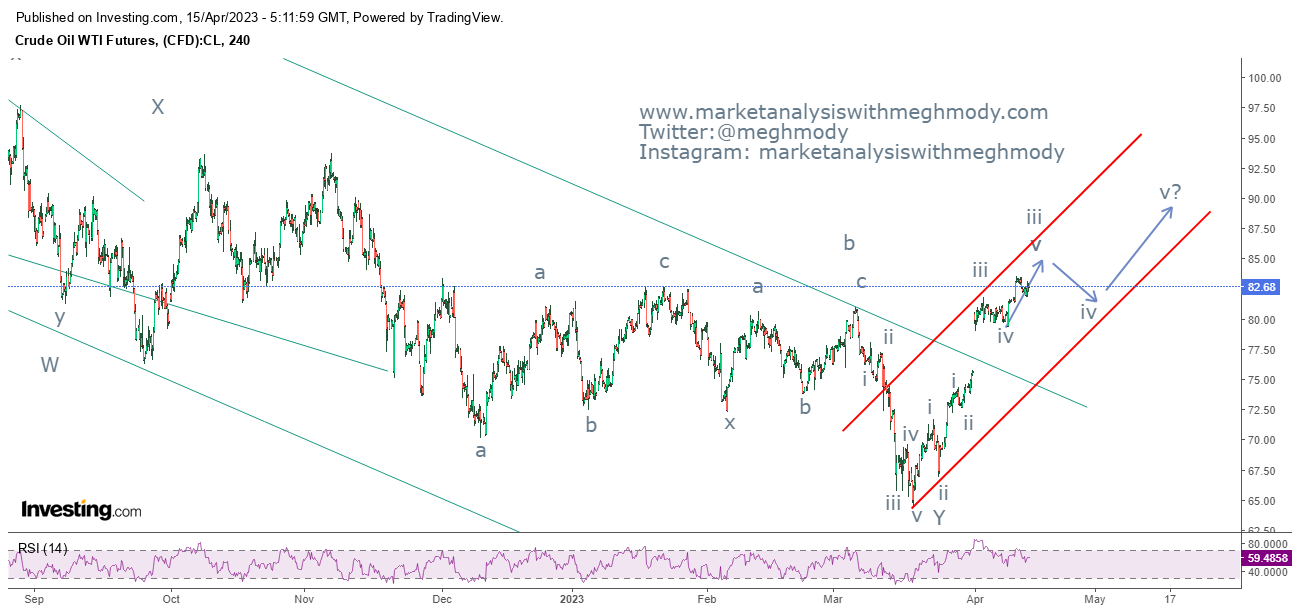
WTI Crude 4 hour chart
Analysis
In my previous update I was of the opinion that WTI Crude Oil price will come down in the range of $77.70-$76.00 and then will achieve the level of $82 followed by $84. The Oil price could not go lower as expected but moved higher towards $83.60 levels.
To read my previous article on WTI Crude, click on the below mentioned link
https://www.marketanalysiswithmeghmody.com/2023/04/wti-and-elliott-counts.html
As seen in the above chart, prices failed to close the rising gap where the bullish breakout happened, I think this gap has come in between the rally and if not filled it can continue to go higher. This gap can be named as a runaway gap and the target of the rally comes to $91.00. I had mentioned the level of $88.00 in my earlier update as well which can be a crucial resistance and possibly an intermediated topping formation.
From Waves perspective, prices are moving in wave iii of wave iii and can surpass $84.00 and can make an attempt towards $85.00. Remember this is the last leg of wave iii as it is in wave v of wave iii which can form an ending diagonal as well.
The summation is WTI Crude Oil can remain in a range of $84.00-$85.00 before its starts correcting. On the lower side $80.00- $79.00 will act as a support.
Join my Telegram Channel : https://t.me/elliottician1
Join My Twitter handle : https://twitter.com/meghmody?


Comments