Posts

Showing posts from February, 2020

Nifty YouTube video anticipated happened

Image
I had made this video on 1st Feb 2020 where I had shown ending diagonal in Nifty. Last week Nifty witnessed correction which was worst in a decade. See the YouTube video on Nifty and learn Technical Analysis and/or ElliottWave NeoWave in my classroom training or webinar. Contact +919324174580

German DAX: Everything in place along with the YouTube video

Image
I had mentioned that DAX has a last leg up pending which can take prices in between 13800-14300 levels which was covered in my last update dated 10th January 2020. Here is the link of the update, click on it https://www.marketanalysiswithmeghmody.com/2020/01/dax-anticipated-happened-and-elliott.html DAX made a high of 13800 which was my last leg or wave five, once it was over what it has witnessed as a sharp selloff due to Corana Virus was also predicted before hand. The fall was made in a video which I want you all to see the date 31st January 2020. It is not so difficult to say that Elliott Wave has helped to to figure the crash on DAX before hand or before Corana Virus came into existence. You can learn Elliott Wave and Neo Wave with me for INR 10500/- or $155. It is a 4 day course and a classroom training if you reside in Mumbai, if in India or other country you can join in on webinar. Here is the video of the crash, do subscribe my YouTube channelfor such more intere

DowJones video on Technical Analysis

Image
DJIA video click and view

Russian Rouble Anticipated Happened and ElliottWave forecast

Image
Russian Rouble daily chart anticipated on 11th Feb 2020 Russian Rouble daily chart happened on 28th Feb 2020 I had anticipated the rise for this currency pair on 11th Feb 2020 and I had also mentioned that it will rise near till 66 levels- Anticipated Happened. Click on the link to read the article on 11th Feb 2020 on Russian Rouble https://www.marketanalysiswithmeghmody.com/2020/02/russian-rouble-elliottwave-forecast.html Now it has moved above the falling channel which opens positive possibilities. So I have marked wave 1 up followed by wave 2 down and wave 3 will cross it's previous high now. Learn ElliottWave and Neo Wave with me in classroom training (Mumbai) or webinar for 4 days. The course fee will be INR 10500/- or $155. It will be 20 hours session. Learn Technical Analysis for 4 months and the fees for that will be INR 12000/- For registration call +919324174580.

Federal Bank: ElliottWave forecast

Image
Daily chart From daily chart of Fed Bank, prices are all poised to fall down from current levels, it is important that the fall will not be dynamic but more of a corrective in nature. The first fall was a corrective fall (a-b-c-x-a-b-c) which competed wave w followed by wave x which was counter wave and what we are witnessing is wave y in which wave a and wave b is over now wave c has started which can go till 67 levels.

EURINR: All set to tumble (ElliottWave forecast)

Image
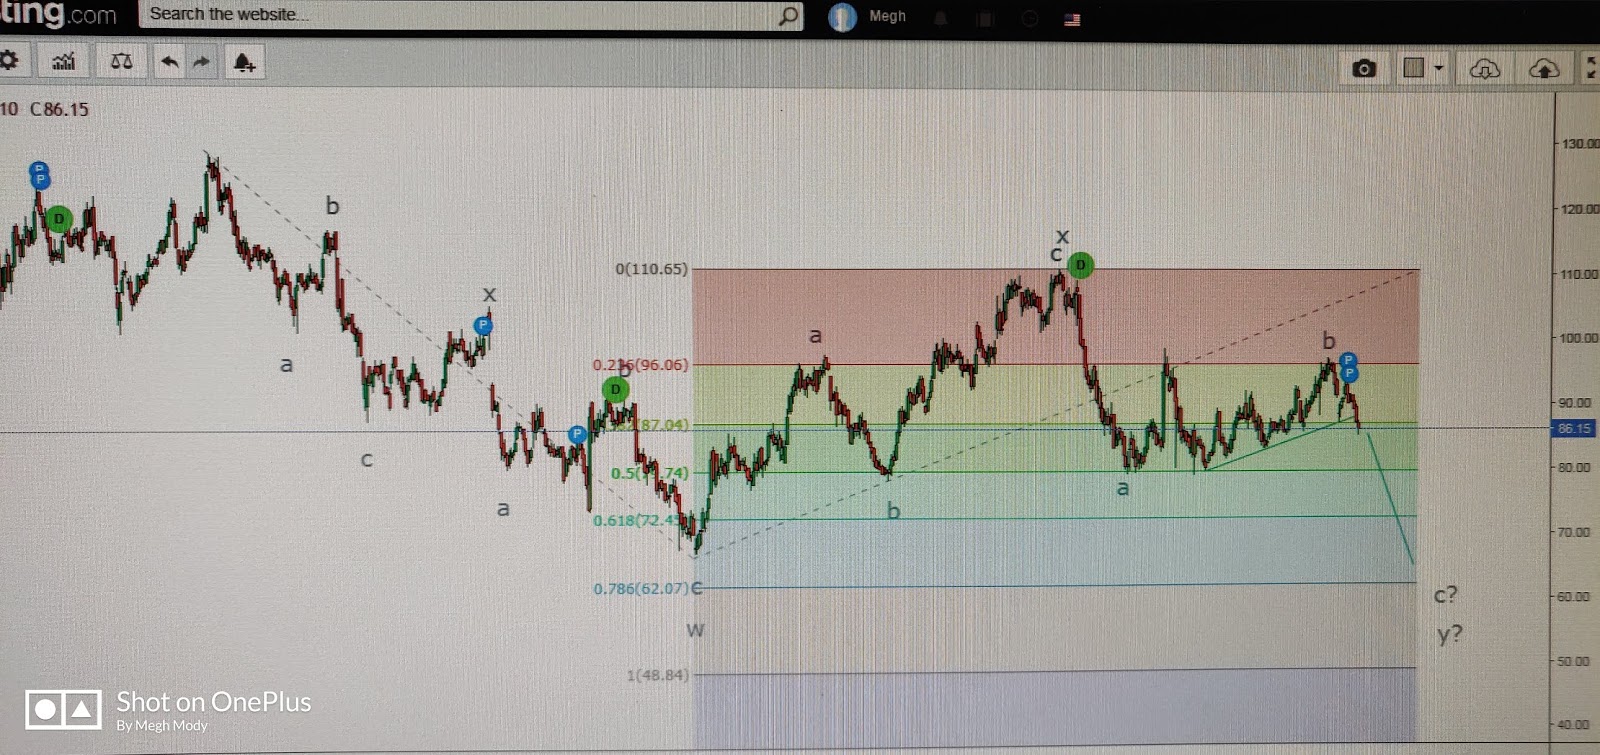
Daily chart of EURINR Classic bearish head and shoulder pattern is seen in the above chart after giving a break in the month of March 2019, after that prices re-tested the neckline twice. Twice it failed to move above the neckline and finally shedding the gains it managed to maintain.  As per wave theory, I am putting a zigzag pattern when the head was formed. A zigzag is a three wave structure in which it has already completed wave a and wave b which means wave c is pending down. As per zigzag theory wave c can retrace 61.8%  of wave a to wave b so it can tumble till 73.1. This theory is difficult to implement on various charts but you can learn from me in my 4 day course, classroom training and webinar available. The cost for the same is RS, 10,500/- contact +919324174580

MCX Natural Gas Anticipated Happened: Elliott Wave forecast

Image
MCX Nat Gas on 3rd Jan 2020 Anticipated MCX Natural Gas on 11th Feb 2020 In my previous update on Nat Gas I had been mentioning that prices will move down till 125-120 levels when it was quoting at 153-155 levels. Check out the article in te given link below https://www.marketanalysiswithmeghmody.com/2020/01/mcx-nat-gas-symmetrical-triangle-and.html Nat Gas made a low of 125.7 on 11th Feb 2020 from 153-155 from where I had anticipated that fall by using the below given theory which is Elliott Wave. I was anticipating a symmetrical triangle pattern which in this case was perfect, since last leg which is wave e was pending I anticipated that it will tumble till 125-120 levels. I now feel that the downside is over and prices are now poised to reverse from current levels which can take back near till its previous high of 200. Learn Technical Analysis with me in my 4 month course covering all the important concepts of the market along with its practical applications.

USDCAD: ElliottWave forecast video

Image
YouTube channel meghmody Learn ElliottWave NeoWave my 4 day course in which you will learn the market participant behavior and all the patterns involved. Contact +919324174580 costing will be 10500/-

Russian Rouble: ElliottWave forecast

Image
Daily chart of Russian Rouble The currency is moving in a falling channel as it is seen in the above chart. Also to be observed that prices have recently taken support from the lower end of the channel and is now inching towards the resistance. The pair has strong support at 62.5 for further advancement. From wave perspective, prices are poised to move up till 66 levels which can be either wave x or i. As it has completed (a-b-c) pattern. Learn Technical Analysis course in RS 12000/- and ElliottWave and NeoWave in 10500/- call +919324174580.

EURUSD: Elliott Wave forecast

Image
EURUSD daily chart From the above chart is is very clear that the trend of the single currency is negative. Especially, after making the high it is now moving in a lower high and lower low formation which is a negative sign. As per wave theory, prices are moving in a complex correction pattern. (a-b-c-x-a-b-c) the second correction after wave x is in process in which wave c has started which can reach till 78.6% of the previous rise which is placed at 1.08 Learn ElliottWave NeoWave with me in my 4 day course webinar and classroom training available, the fees for the same is 10500/- contact +919324174580.

Mexican Peso: ElliottWave forecast

Image
Mexican Peso daily chart In the above chart, it is so clear that prices have broken the triangle pattern. This making it clear that the trend is negative. A symmetrical triangle pattern when is completed we should always wait for the breakout. However, ElliottWave has a different approach for it. As per wave theory, prices have completed wave b in a triangle pattern which looks to be a zigzag as wave e of triangle ended at 61.8% of it's previous wave a. This means wave c can now move down near till wave a which is placed at 17.50. Learn Technical Analysis course and ElliottWave in Mumbai- classroom training and webinar available. Contact +919324174580

US 10 year treasury Yield Anticipated happened (Elliott Wave Forecast)

Image
US 10 Year treasury yield daily chart Anticipated on 31st December 2019 US 10 Year treasury yield daily chart happened Feb 2020 In my previous update I had mentioned that, " 10 year yield of US and it is suggesting that wave iv in a Slanting triangle is on the brink to complete after an extended third wave. After wave iv, wave v will move down which can drag prices lower below the end of wave iii. " Here is the link of that update https://www.marketanalysiswithmeghmody.com/2019/12/us-10-year-treasury-yield-elliott-wave.html Wave v has a peculiarity of either going down below wave iii end or it won't go, it will be important to see from here. Well I had forecasted the fall and it seems that my prognostics are working well enough. You can also learn this with me. Learn Elliott-Neo wave webinar/ classroom training for 4 days with me which will cost you RS. 10,500/- and will make you learn the theory and practical application of time and price. Don't fol

Technical Analysis Course 2020

Greetings Everyone!!!                                My name is Megh Mody, a technical analyst with an experience of over a decade in free floating markets. I have been working in Equity, Commodity and Currency markets and have expertise in forecasting the direction of price and trading it.  I am now going to teach you how to trade with help of trading tools like simple trend line or any other tools for effective trading and making a fortune from it. A trade setup to identify and make most of it.  I have come up with two courses for you, for those who are unaware of Technical Analysis and for those who are Course Time Fees Technical Anaysis 4 months 12000/- Elliott and Neo Wave  4 days 10500/- It is not worth to follow the crowd blindly but to use your knowledge and identify a trade setup to trade. It is always better to think objectively before trading. For registration call +919324174580. 

Why I was correct in anticipating MCX Crude Oil (Elliott Wave Forecast)

Image
MCX Crude Oil 28th January 2020 (Anticipated) MCX Crude Oil 11th February 2020 (Happened) From the above chart I was continuously saying when Crude oil price was trading above 4000-4100 that it will falter near till 3500. Well we will not go in depth but I can relate with the recent move from 28th January where Crude was trading at 3770-3800 levels and I had forecasted that it will tumble till 3500. Here is my YouTube channel link where I had mentioned, click on the link to view the video https://youtu.be/oz1fvjRwzfI Now it is imperative for rices to break the level of 3500 which is the trend line support as see the the above chart, once this breaks there is a high possibility for prices to move down till 3000 levels. As per wave theory, the black gold is moving in wave (c) of wave b, wave c can move close to wave a which is near to 3000 levels. Learn Elliott Wave and Neo Wave in my 4 day course which will open a new approach in identifying reversals and riding