Federal Bank: ElliottWave forecast
Daily chart
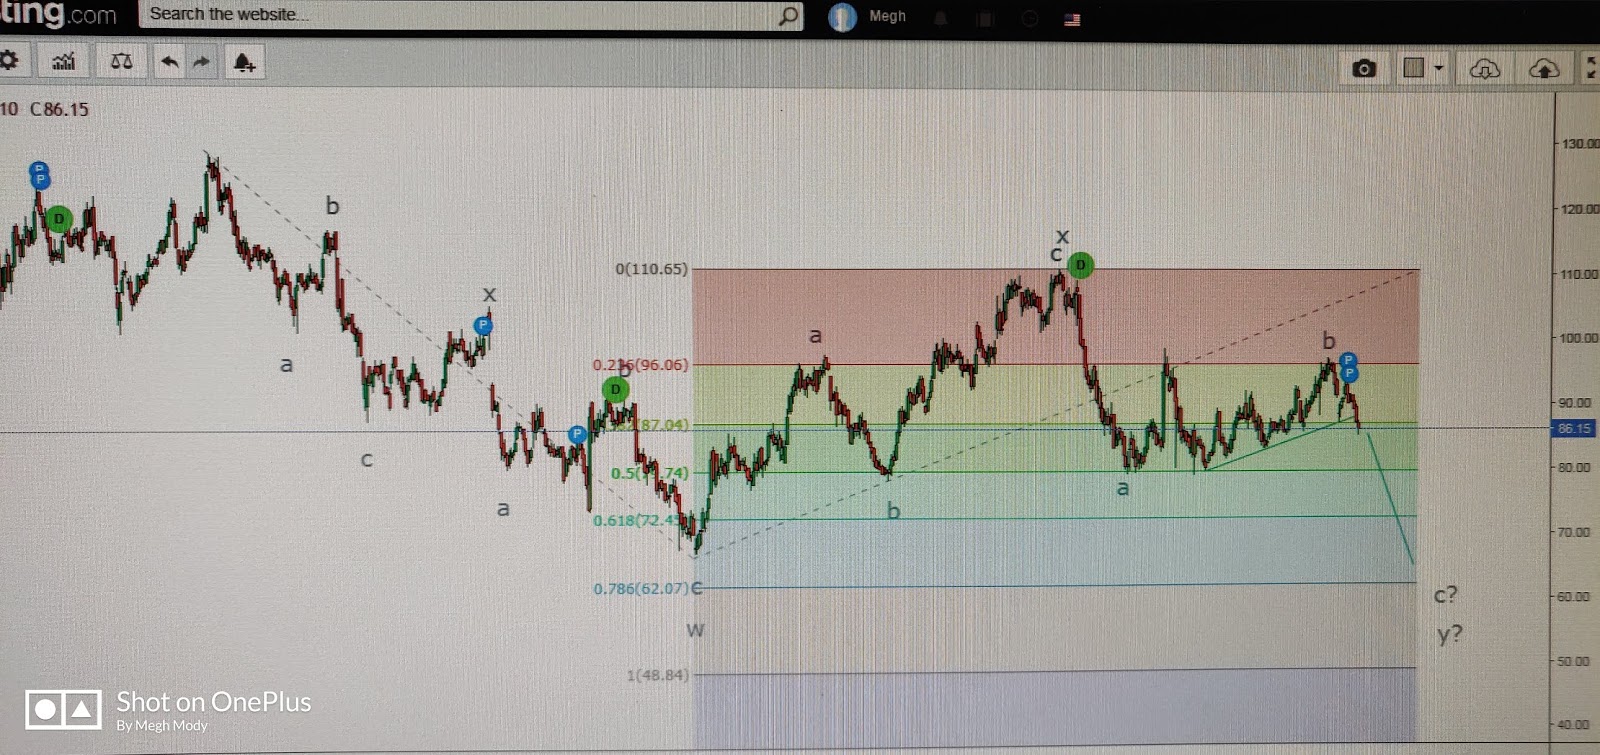
From daily chart of Fed Bank, prices are all poised to fall down from current levels, it is important that the fall will not be dynamic but more of a corrective in nature.
The first fall was a corrective fall (a-b-c-x-a-b-c) which competed wave w followed by wave x which was counter wave and what we are witnessing is wave y in which wave a and wave b is over now wave c has started which can go till 67 levels.


Comments