Posts

Showing posts from March, 2021

Nifty Elliott Wave analysis

Image
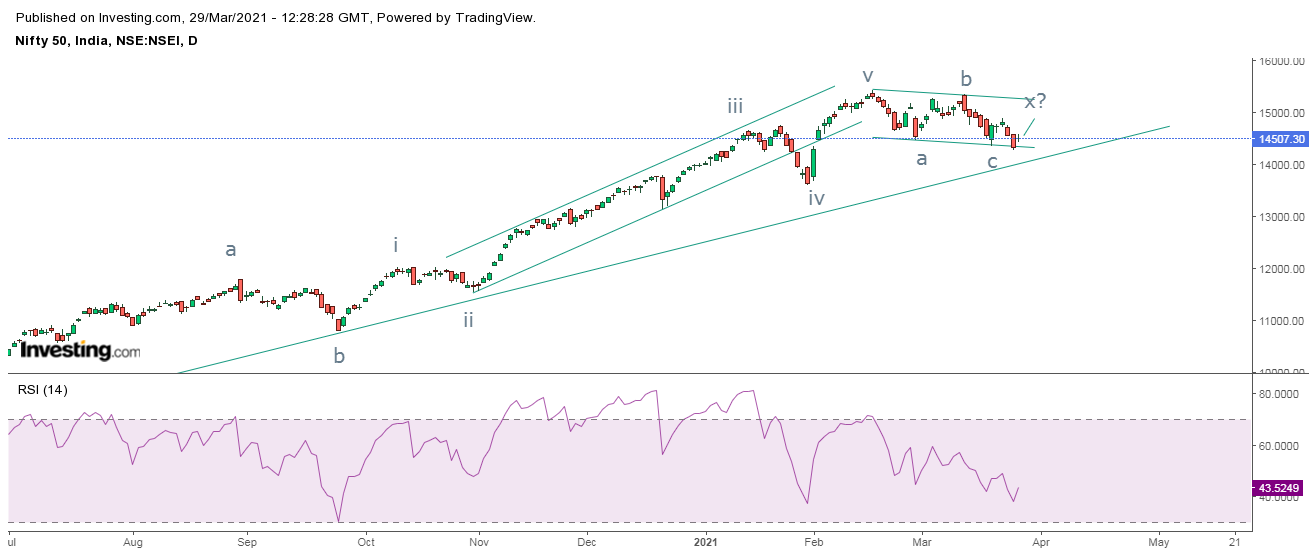
Nifty daily chart  Nifty hourly hart From the above daily chart, the index is moving in a sideways to negative direction and has started making lower highs and lower lows. This is an indication that the short term trend has now turned negative. The index has a crucial support at 14100-14000 levels where the rising trend line is placed. It is likely that there will be resilience from current levels which can push the index near to its previous high. Daily RSI has still not broken its previous low. In hourly chart, prices are moving in a falling channel, it has found support near to the lower trend line of the channel and has bounced from there several times. On last Friday, the index opened with a gap up and continues to soar. RSI has a support at 30 and it shows that it is now moving higher. From Waves perspective, the Nifty is moving in double correction where after completing (a-b-c) in flat pattern, it is now forming wave x which is also a flat pattern and in which wave c is pen

MCX Copper Anticipated Happened and Elliott Wave Analysis

Image
 MCX Copper hourly continuous chart anticipated on 13th Mar 2021 MCX Copper hourly continuous chart happened on 19th Mar 2021 In my previous update dated 13th Mar 2021, I had mentioned for MCX Copper, " MCX Copper can move down till 660 levels once the level of 674 is broken accelerating selling pressure. Failure to protect the level of 687 will open positive possibilities." Prices slumped till 660 levels marking a low of 659 on the last trading day of the week once the level of 674 was broken. Anticipated Happened To read the previous article on MCX Copper here is the link https://www.marketanalysiswithmeghmody.com/2021/03/mcx-copper-elliott-wave-analysis.html Now since it has completed wave a-b-c pattern it is now clear that the red metal will travel north o form another pattern. This means the first correction fallen from the highs was wave a at one higher degree, so now wave b will start or  might have started which can soar prices. So wave a of wave b can move up  till 6

Nifty Anticipated Happened and Elliott Wave Analysis

Image
 Nifty hourly chart anticipated on 13th March 2021 Nifty hourly chart happened on 19th March 2021 On my previous update mentioned on 13th March 2021, I had mentioned for Nifty, " Nifty is all poised to move down once the level of 14900 is broken which can drag prices till 14400-14300 price zone." Nifty after breaking 14900 stumbled till 14350 levels which was marked on 19th March and was also the mentioned level falling in the price zone of 14400-14350 levels. Anticipated Happened For reading the previous article on Nifty, click on the link https://www.marketanalysiswithmeghmody.com/2021/03/nifty-elliott-wave-analysis.html Nifty is now moving in a falling channel and it has shown signs of reversal from the support of the channel and also the falling trend line which was acting as a cruical resistance is broken which opens positive possibilities. This states that the index can move higher from current levels near till 15100-15200 levels where the resistance of the channel is p

MCX Zinc Elliott Wave Analysis

Image
 MCX Zinc daily continuous chart MCX Zinc hourly contiuous  As shown in the daily chart, MCX Zinc is moving precisely above the rising trend line and also forming higher highs and higher lows which is a positive sign. At present the metal is trading near the support of the trend line and can bounce from current levels to test its previous high. RSI is hovering between the center line. From hourly chart, prices have not discontinued the positive pattern and so there are high chances for the metal to move higher from current support area. However, RSI is in overbought terrain which will make the counter move sideways to negative in the early week but can reach till or near to its previous high As per Wave theory, after completing wave v higher, prices moved down in complex correction (a-b-c-x-a-b-c) and completed wave a. Currently it is moving in wave b in which it has completed wave a and wave b, this opens wave c higher which can travel till 7836-80% of the recent fall which comes to 2

Wipro Elliott Wave Analysis

Image
 Wipro daily chart From the above chart, the IT stock which was persisting above the rising trend line has given a bearish break by trading below it. Also to embellish, prices have discontinued the higher highs and higher lows formation which is making the formation weak. As per Wave theory, prices are moving in a complex correction (w-x-y-x-z) where in wave z there is a descending triangle pattern. The breakout of the triangle is bearish thereby confirming a topping process and also end of wave z. Now the stock can plunge near to about 370 levels over short term with immediate resistance at   416 levels. Elliott Wave is difficult to practice, but you can learn with me the theory along with its practical applications. The one month webinar is going to start from April, the details are mentioned below. Learn Technical Analysis in our 4 month course to help you to identify better trade setups. This course will be conducted every twice in a week for around 2 hours. This theory can be appl

ACC Elliott Wave, Impulse wave, Ending Diagonal

Image
 ACC daily chart From the above daily chart of ACC, prices are moving in a higher highs and higher lows which clearly indicates that the trend is firmly positive. However, prices are moving in a distribution pattern which is known as rising wedge pattern. The pattern is accompanied by negative divergence in RSI indicating halt in positive momentum.  From Waves perspective, the stock is moving in an ending diagonal pattern which arrives in wave v. Thus opening the possibility of correction. Prices are set to dive in coming trading sessions near about 1640. Manually counting waves is difficult task, but with the help of proper application of theory put into practice you can not only count but forecast with me in my one month exclusive webinar. The webinar is all set to start from April 2021, the details are mentioned below. Learn Technical Analysis in our 4 month course to help you to identify better trade setups. This course will be conducted every twice in a week for around 2 hours. Th

MCX Copper Elliott Wave Analysis

Image
MCX Copper continuous contract hourly chart   From hourly chart, the red metal is now moving in a lower highs and lower lows and persisting below the falling trend line which is a negative sign. At present, it is hovering near to the resistance of the trend line and can move down from there in coming trading sessions. After falling from the top, prices are now moving in a sideways direction which can be a symmetrical triangle and once there is a breakout in a triangle pattern, a clear trend can be seen. The metal can give a trending break in either side. As per Wave theory, prices completed wave a, currently I is moving in wave b which is forming a triangle pattern, this opens wave c lower. However, any move above 687 will negate the downside target and the trend will change from down to up. The summation is MCX Copper can move down till 660 levels once the level of 674 is broken accelerating selling pressure. Failure to protect the level of 687 will open positive possibilities.

Tata Power Elliott Wave Analysis

Image
 Tata Power daily chart Tata Power hourly chart As shown in the daily chart, Tata Power is moving up by crossing its previous high. To embellish, the angle of the rising channel are becoming steeper and steeper which gives an indication that the trend is becoming stronger. From hourly chart, the stock is has given a bullish break in a symmetrical triangle pattern and can move higher from current levels. However, it has arrived to the resistance of the channel, from where it has reversed several times. There are chances it might go sideways to negative but will make a new high before reversing. From Waves perspective, wave i and wave iii are equal, at present it is moving in wave v in which it is extended. Wave iii of wave v is extended and so it has either completed wave iii of wave v and wave iv lower will start followed by wave v of wave v higher. The second scenario will be wave v to extend which looks least likely, but still open. The summation is Tata Power is firmly positiv

Nifty Elliott Wave Analysis

Image
 Nifty daily chart Nifty hourly chart From the daily chart, the index continues to move in a higher highs and higher lows and there is no change of trend. However, there are instances where prices halt and move down towards the support. On Friday, prices opened with a gap up, but could not sustain which made a red candle, thus failing to cross its previous high. This clearly indicates that correction is due. Daily RSI has exhibited negative divergence which is an indication of a halt in positive momentum. As shown in hourly chart, prices are moving in a rising wedge pattern and have given a bearish break, which is a negative sign. Any move below 14900 will slump the index till 14400 levels over short term. The pattern target comes to 14300 levels. So I think Nifty is all poised to move down in between 14400-14300 levels. As per Wave theory, the index after completing wave v at 15435 levels have started moving in corrective wave, where it completed wave a and wave b higher. This ope

MCX Crude Oil Wave equality and analysis

Image
 MCX Crude Oil daily chart As shown in the daily chart, MCX Crude Oil is moving in a higher highs and higher lows after moving below 0 levels. It can also be seen that, prices have moved above cluster of resistances (marked by black horizontal line). However, it is RSI which has moved in overbought terrain. Now the level of 4700 will act crucial as it will provide good support to this counter. There are high chances it will move down to test it. Any sustainable move above 4700 will take prices higher to 5000-5100 price zone over short term. Failure to protect the level of 4700 for couple of days will see some correction. From Waves perspective, the MCX Crude Oil is moving in impulse fashion. Where it has completed wave I and wave ii and it has either completed wave iii or it is still ongoing. As wave i and wave iii are equal in terms of price. The summation is MCX Crude Oil has an important support near 4700, sustainable move above this level will surge it to 5000-5100 price zone

PNB Elliott Wave Analysis and Technical Analysis

Image
 PNB daily chart PNB hourly chart From the daily chart, prices recently crossed its cluster of resistance and it is trading above it. Now the horizontal line which was earlier acting as a resistance will now be a support. It is very likely that it will come to test the level of 40-39 which is a good level to buy. Also there is a pattern of double bottom which is recently completed with heavy volumes. The target of the pattern comes to 50 levels for this PSU banking stock. As shown in hourly chart, the stock recently crossed its previous high thus discontinuing lower highs and lower lows and is all set to move higher from current levels. RSI has arrived near the oversold terrain and can reverse, once price starts moving higher. As per Wave theory, the stock is on the brink to complete wave (ii) of wave iii. Wave iii is extended and can move higher close to 50-52 levels over short to medium term. The summation is PNB is positively poised and can move higher from current levels near

Tata Steel Anticipated Happened and Elliott Wave Analysis

Image
 Tata Steel hourly chart anticipated on 6th Feb 2021 Tata Steel hourly chart happened on 1st Mar 2021 In my previous update I had mentioned about Tata Steel is, " Tata Steel is moving in a positive territory and can reach till 735-745 price zone going ahead with support at 640 (closing basis)." This article was written when the price was quoting at 685 and it reached my mentioned level of 735-745 thus gaining 9%- Anticipated Happened. To now about my previous article on Tata Steel, click on the link https://www.marketanalysiswithmeghmody.com/2021/02/tata-steel-elliott-wave-analysis.html As of now it is trading in wave 5 in which it is moving in wave iii of wave 5 and then it will move down to complete wave iv of wave 5 and then final leg of the impulse. So there is still room for prices to move higher from current levels. Wave theory is difficult to interpret and more difficult to practically apply, learn with me in my one month webinar and start practicing in my webinar. The

Motherson Sumi Anticipated Happened

Image
 Motherson Sumi hourly chart anticipated on 22nd Feb 2021 Motherson Sumi hourly chart happened on 3rd March 2021 In my earlier update dated on 22nd Feb 2021, I had mentioned that, " Motherson Sumi is all set to surge towards 235-238 levels over short to medium term with supports placed at 204-200 levels (closing basis)." Prices found support near to 204 levels and started picking up momentum and moved sideways in the range of 225-210 levels. Thereafter it broke the range and achieved my mentioned level of 235-238- Anticipated Happened. Here is the link of my previous article on Motherson Sumi which I had anticipated, click on the link https://www.marketanalysiswithmeghmody.com/2021/02/motherson-sumi-elliott-wave-analysis.html It is not easy to practically apply Wave counts on charts, but you can learn with me in my on month webinar. It will not only be theory but also how to mark wave counts on different charts and its time frame. Then details of the course is mentioned below