Posts

Showing posts from July, 2020

Nifty Weekly Elliott Wave Analysis

Image
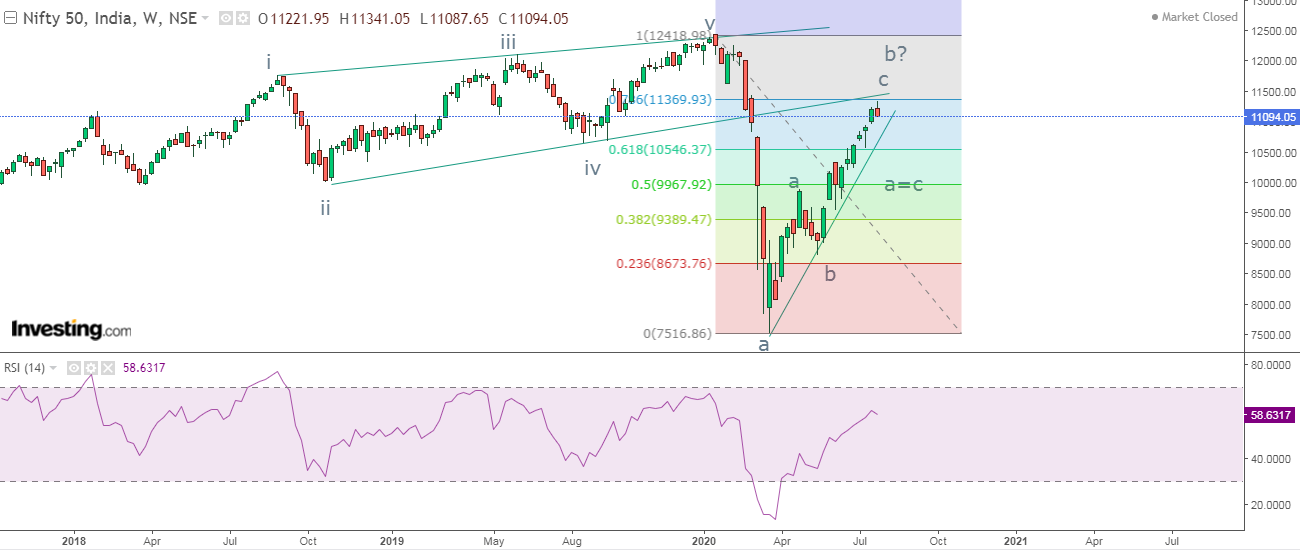
Nifty Weekly chart Nifty is moving up steeply opening up the possibility of a 'V' shape recovery or a next bull run. Many traders and investors are sure about a new high coming soon. However, by combining traditional technical analysis with advance technicals, my view for the index is presented below. I have taken weekly chart to explain my analysis, as last time I had explained it on daily chart where I was sure that it will not cross 11050, but it did. In the above weekly chart, prices are moving in a higher highs and higher lows which is a positive sign but on expiry day (July series), the index made a high of 11300 and reversed, closing at 11100. Now doubt, prices are trading above the rising trend line which is a positive sign and shows that the trend is intact, but it is facing the resistance of the ending diagonal or rising wedge pattern. This means the index is hovering at the lower trend line of the pattern, which is seen in the chart. With the help of Fibonacci retrac

Nifty Elliott Wave Analysis

Image
Nifty Daily chart Nifty hourly chart In the above daily chart, the index is strong as compared to Nifty Bank which was covered last week.   Nifty is moving in a higher highs and higher lows, but the positive momentum is slowing down as the candles are making smaller bodies as compared to bodies at lower levels. It is to understand that this is likely a bull trap as the index is approaching to its crucial resistance. Again, it is an observation and not a confirmation that prices will reverse but it is expected to halt near to 11000-11050 levels. As shown in hourly chart, the index has moved above its previous high last Friday, gaining by over 1.5% up by 162 points. As per Dow theory, it is a positive sign and the bias will continue to be positive in coming days but with caution as daily hourly RSI is lacking vacuum to move any further. In my opinion it will be difficult for prices to even cross 11050 levels going ahead and will reverse sharply once tested the mentioned level. As per

MCX Silver Elliott Wave Forecast

Image
MCX Silver daily continuous chart MCX Silver hourly continuous chart From daily chart, silver is all set to cross its previous high as higher highs and higher lows are intact and prices continue to trade above the rising trend line, all these factors suggest that the bullion is positively poised. However, daily RSI is near to the overbought zone. As per hourly chart, prices are moving higher in a rising channel where resilience was from the lower end of the channel and is now poised to make a new high. Hourly RSI suggest that there is still room for some upside. From Wave theory, after forming flat pattern in wave iv of wave v of one higher degree, prices are now set to move up in form of wave v of wave v. This wave v can be 38.2% or 68.2% of wave i to wave ii. So it is expected that silver will reach till 53600 levels over short term. The summation is prices are set to move higher near till 53600 levels with support at 52400, the bias is positive. Education Learn Technical Ana

Maruti Suzuki: Elliott Wave Forecast

Image
Maruti Suzuki daily chart Maruti Suzuki hourly chart From the above daily chart, the auto stock has rallied from 4000 to 6250 levels in last 4 months. However, the upward rally is now stalled and awaits a direction. It is imperative for prices to either move above 6250 for the rally to continue or to break the support for a correction. Daily RSI has started moving lower after testing overbought levels. As per hourly chart, prices are moving in a rising wedge formation and now it is on the brink to break the support of 5740 which will infuse further selling pressure and will break the lower trend line of the wedge pattern. Once the pattern is broken it will be a confirmation that prices are set for correction. From wave perspective, before wedge pattern, prices have completed the down move in (a-b-c) where wave c is 78.6% of wave a to wave b. Now in wave a or in wave i, leading diagonal is likely and so it is labeled as wave a/i, so now wave b/ii is likely lower till 50-61.8% of the

USDINR: Elliott Wave forecast

Image
USDINR daily continuous contract USDINR is moving higher in a higher highs and higher lows and is all set to cross its previous high of 77 levels. The trend is firmly positive and it is unlikely for prices now to go below 75 levels. So the recent structure where prices are moving happens to be in a falling channel. It recently bounced from the lower end of the channel and it is moving higher, the immediate resistance will b at 75.9 and support will be placed at 75. Daily RSI has turned from oversold terrain. Wave theory suggest, prices is moving in wave iv and as far as it is in the falling channel wave iv will continue to persist. Any move above wave iv or the channel resistance will open wave v higher. The summation is prices are all set to move higher from current levels near till 75.9 and the crucial support will be at 75 levels   Education Learn Technical Analysis in our 4 month course to help you to identify better trade setups. This course will be conducted every onc

MCX Natural Gas

Image
MCX Natural Gas daily continuous chart MCX Natural Gas hourly chart From daily chart, the energy commodity is set to move towards its immediate resistance after a surge is price from near about 110 levels. Daily RSI is above the center line which is a positive sign and can move higher towards overbought territory. As per hourly chart, prices have retraced near about 50% of the previous up move (115-144.5) after that it re-entered the falling channel and it is set to move higher from current levels. The immediate resistance stands at 145 levels. From Wave theory, NG has completed wave b on the lower side and wave c on the higher side has already started which can move near till its previous high. The summation is prices are set to move higher near till 145 levels with support at 130, the bias is positive. Education Learn Technical Analysis in our 4 month course to help you to identify better trade setups. This course will be conducted every once in a week for around 4 hours. Thi

DLF: Elliott Wave Analysis

Image
DLF daily chart DLF hourly chart From the above daily chart, prices have arrived near the support of the rising trend line, it is likely that this support will break, thus giving a bearish breakout. RSI is also moving towards oversold terrain which makes this stock not so strong. As per hourly chart, the realty stock is on the brink to break the trend line support which can only happen if it breaks below 145 levels. Any move below 145 can make the sellers active which drag it till 136 levels. From wave perspective, prices have moved up in a three wave structure which is labeled as wave a at one higher degree and after that wave b is still pending on the lower side which can be 61.8-100% of wave a to wave b of wave b (shown in hourly chart). The summation is poised to falter once the level of 145 is broken which can plunge the stock price till 136 levels. Education Learn Technical Analysis in our 4 month course to help you to identify better trade setups. This course will be con

Nifty Bank: Elliott wave analysis

Image
Nifty Bank daily chart Nifty bank hourly chart In the above daily chart, the index is now failing to cross 23100 levels which is now a resistance zone. Prices continue to move in an upward channel where it has arrived to its resistance and is now showing signs of reversal. Daily RSI which is on the lower panel of the chart is also reversing from the overbought terrain.    As shown in hourly chart, Bank index happens to arrive near cluster of resistances. The first resistance is where the rising channel is placed, the second is the rising wedge pattern which is on the brink to complete, any move below 22000 will infuse selling pressure dragging it way lower near to the support of the channel. As per Wave theory, prices have come to 100% of wave a to wave b where it has completed wave c in ending diagonal formation. Any move below 22000 will give a bearish break of the pattern and will drag prices till 20500-20200 range. This down move can be labeled as wave x or one higher degree of

Hindalco: Elliott Wave Analysis

Image
Hindalco Weekly chart Prices which were moving in  a falling channel and broke below it has now finally re-entered the channel, this opens positive possibilities. As per wave theory, prices faltered in a three wave structure which was complex esp. at the earlier correction. Later on it was clear and completed wave c near to 100% of wave a to wave b. As of now it is moving in impulse fashion in which there is still room for it to move a bit higher before starting wave ii lower. Learn Elliott Wave with me in my one month webinar course, scheduled twice a week for two hours and learn theory and practical applications with me. The fees for the same will be Rs. 10500/- for registration call +919324174580.

TATA MOTORS; Rounding bottom/ Bullish cup and handle in making

Image
Tata Motors Daily chart Tata motors is one of the under performer in sync with its peers, but off lately there is a pattern which is in process to complete which will open positive signals atleast for short to medium term for this auto stock. Yes, I am talking about rounding bottom and/or cup and handle, but this pattern is still not complete, no doubt it took over 35-40 trading sessions just to build it but it is not complete. Once this pattern is complete it has brilliant chance to surge till 175 levels over short to medium term (again I am not discussing it). You can learn Technical Analysis/ Advance Technical Analysis with me, below is the mentioned details: Elliott and Neo Wave analysis is conducted for 1 month, this is an advance technical course suited for professional traders. Twice a week, 2 hours will be given for theory as well as practical application. The fees for it will be Rs. 10,500/-. Technical Analysis is a 4 month course both classroom training and webinar available