Nifty Weekly Elliott Wave Analysis
Nifty Weekly chart
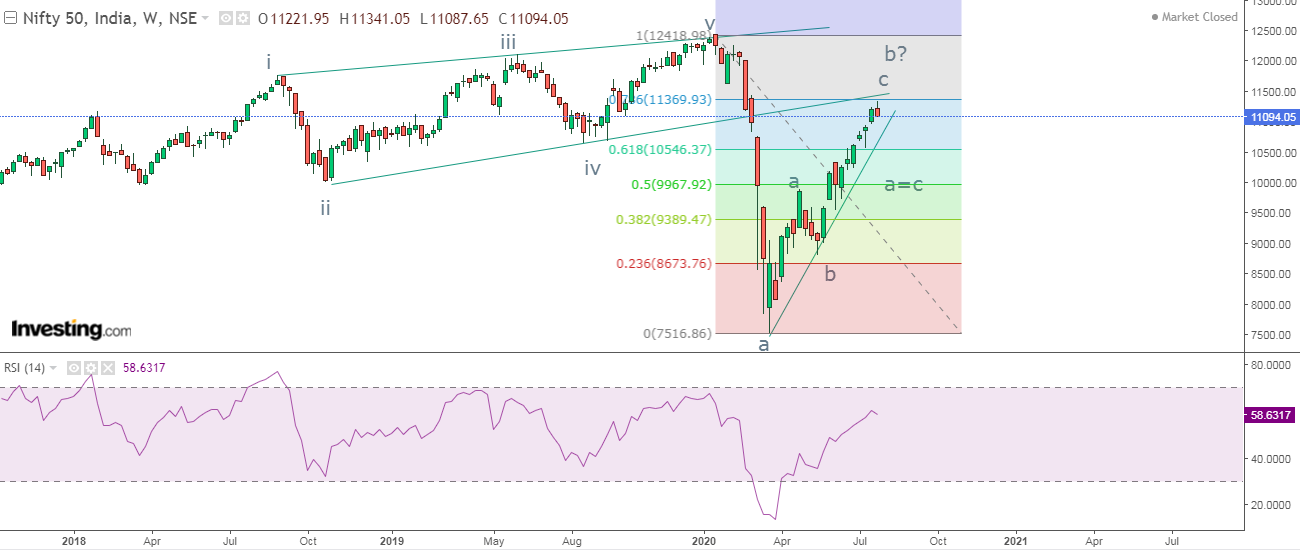

Nifty is moving up steeply opening up the possibility of a 'V' shape recovery or a next bull run. Many traders and investors are sure about a new high coming soon. However, by combining traditional technical analysis with advance technicals, my view for the index is presented below.
I have taken weekly chart to explain my analysis, as last time I had explained it on daily chart where I was sure that it will not cross 11050, but it did.
In the above weekly chart, prices are moving in a higher highs and higher lows which is a positive sign but on expiry day (July series), the index made a high of 11300 and reversed, closing at 11100. Now doubt, prices are trading above the rising trend line which is a positive sign and shows that the trend is intact, but it is facing the resistance of the ending diagonal or rising wedge pattern. This means the index is hovering at the lower trend line of the pattern, which is seen in the chart.
With the help of Fibonacci retracement Nifty is facing resistance of 78.6% from the all time high to the recent low of 7500 which is also visible in the chart. also the recent upmove from 7500 to 11300 marks to 100% of wave a to wave c of wave b.
Understanding Wave theory is complex ut I have made efforts to explain you from the above chart. My manual plotting after the Budget was announced and the start of pandemic made me mark wave a at 7500, after that a three wave structure is clearly seen which is wave b and now wave c or wave x is forthcoming This indicates a plausible correction to come as prices are not able to cross cluster of resistances, which can drag prices lower in Aug series.
Education
Learn Technical Analysis in our 4 month course to help you to identify better trade setups. This course will be conducted every twice a week for around 2 hours. This theory can be applied on all free floating markets. In this course learn from basic to advance and the fees for the same will be Rs. 12,000/-
Elliott and Neo Wave analysis is conducted for 1 month, this is an advance technical course suited for professional traders. Twice a week, 2 hours will be given for theory as well as practical application. The fees for it will be Rs. 10,500/-.
Classroom training and webinars both are available. If you reside in Mumbai, classroom training is conducted in Vile Parle near station and Borivali Station. For inquiry and registration call +919324174580.


Comments