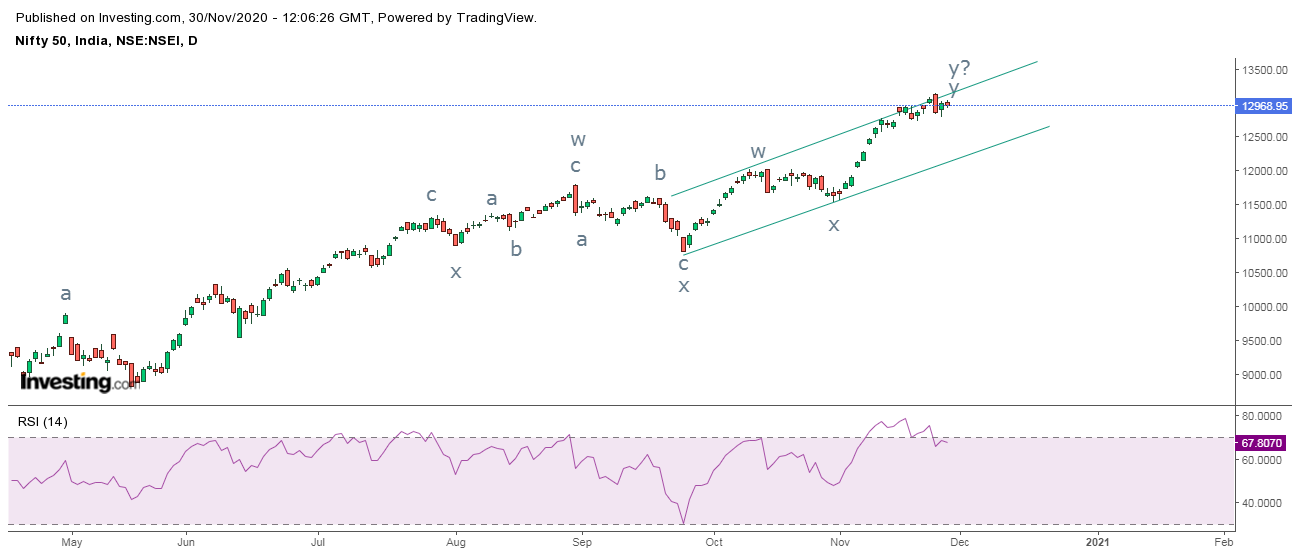
Nifty Bank Elliott Wave Analysis

Nifty Bank daily chart Nifty Bank hourly chart From the above daily chart, Nifty Bank is currently moving in a sideways pattern at the top and also there is a distribution pattern occurring supported by negative divergence in RSI making it difficult for the index to move up further. Again just like Nifty, banking index need to break its previous lows to plunge in coming trading sessions. As per hourly chart, Prices are consolidating near the resistance of the rising channel making the index halt its positive momentum. Prices need to break the level of 28860 levels for downside to open. The index is also forming a rising wedge pattern which breaks on the downside. It is advisable to wait for the bearish breakout to occur. RSI is exhibiting negative divergence. Elliott Wave theory suggests that, Prices are forming ending diagonal pattern in wave c of wave y at one higher degree, which will open negative possibilities going ahead. Once this pattern is completed it is evident that the