Posts

Showing posts from February, 2021

SBIN Anticipated Happened

Image
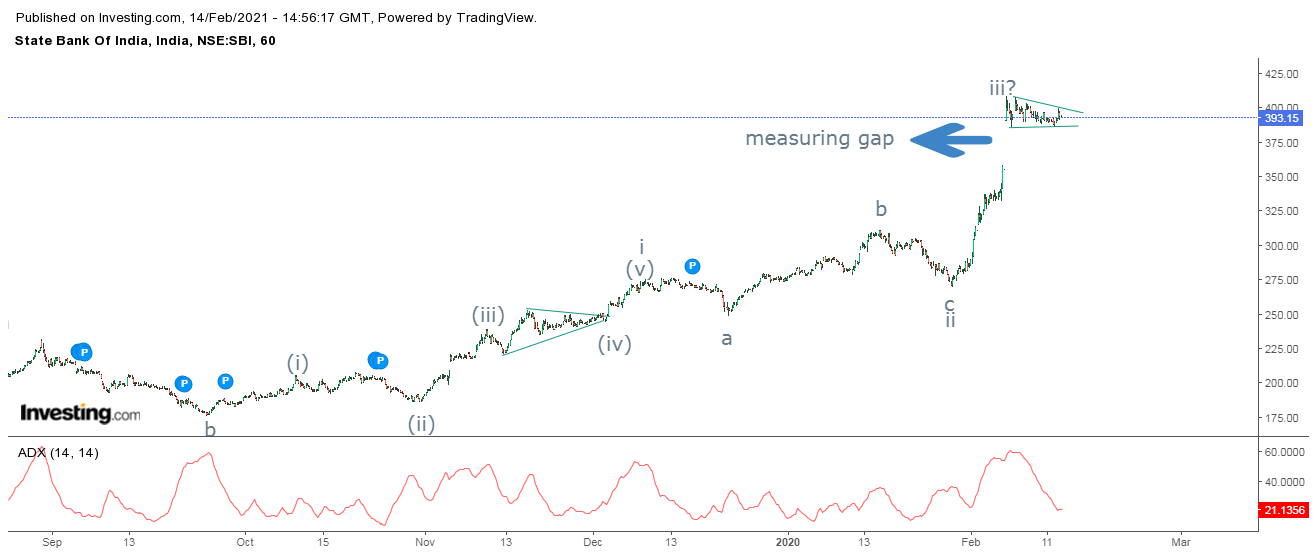
 SBIN hourly chart anticipated on 14th Feb 2021 SBIN hourly chart happened on 18th Feb 2021 In my previous update on SBIN  dated 14th February, I had mentioned that, " SBIN is set to conquer 417-420 levels provided the level of 386 is intact on the downside. Any move below 386 will negate the triangle pattern, and it will open other corrective patterns."- Anticipated Happened. Prices marked a high of 429 levels, thereby achieving my mentioned level of 417-420 levels. Here is the link of my previous article of SBIN dated 14th Feb. Click on the link https://www.marketanalysiswithmeghmody.com/2021/02/sbin-elliott-wave-analysis.html It is difficult to place manual wave counts without knowing the theory. You can learn the theory along with practical applications of Wave Analysis. It will be a one month webinar and the details are mentioned below. Learn Technical Analysis in our 4 month course to help you to identify better trade setups. This course will be conducted every twice in

BHEL Elliott Wave Analysis and Technical Analysis

Image
 BHEL daily chart As shown in the daily chart, the stock is forming a higher highs and higher lows and has crossed an important resistance of 44 with volumes which is been highlighted. This breakout is very important as it also completes rounding bottom formation and its target comes to 65-67 levels which is expected to reach over medium term. To embellish, prices which were moving in a rising black channel has moved above its resistance, which indicates in shift of angle. This happens when prices are stealth uptrend and it is suppose to move above the resistance of the channel which will now act as a support. From Waves perspective, the stock is moving in wave iii and it is undoubtedly clear that it is an extended wave where wave iii of wave (iii) is extended and can move up till 58 levels over medium term. Followed by wave iv and then wave v which can lead to 65-67 levels. The summation is BHEL is in stealth uptrend and expect it to move till 58-60 levels over short to medium t

Coal India Elliott Wave Analysis

Image
 Coal India daily chart Coal India hourly chart From the daily chart, prices have given a bullish break by crossing cluster of resistance as seen in the above chart. Also it has crossed with a gap up opening, indicating that it is a breakaway gap and remains unfilled as of now. Now the level of 144 will act as a crucial support to this stock as it was acting as a resistance earlier. RSI has also relieved from the overbought terrain. As shown in hourly chart, prices are moving in a higher highs and higher lows fashion and currently it is moving down to find the support. As of now it has found rising channel support and can move higher from current levels. However, if it slips from here it can move down till 148-146 levels which can be a buying opportunity. As per Wave theory, the stock is moving in wave iii of either wave iii/c. At present the ongoing wave iii is extended in which wav iv is ongoing which can retrace till 38.2-50% from wave ii to wave iii. On the downside it can go t

UPL Anticipated Happened and Elliott Wave Analysis

Image
 UPL daily chart UPL hourly chart In my previous update dated on 18 th Jan 2021, I had mentioned that, “ UPL has strong support placed at 480, as far as it is protected on the downside the stock can reach in the prices zone of 595-605 levels.”- Anticipated Happened. Here is the link of my previous update on UPL, click on it https://www.marketanalysiswithmeghmody.com/2021/01/upl-elliott-wave-analysis.html As shown in the daily chart, it is very clear that prices have bounced from the lower Bollinger band and has also move above the mean, which now opens the possibility for prices to test the upper Bollinger Band which is placed at 580 levels. Daily RSI is also moving higher which is a positive sign as it is above the center line. From hourly chart, prices are persisting in the rising channel and it is moving higher after it took support from 530 levels. It also gave breakout from the falling trend line which is a positive sign, indicating soar in prices. From Waves perspective,

Motherson Sumi Elliott Wave Analysis

Image
 Motherson Sumi daily chart Motherson Sumi hourly chart From the daily chart, prices continue to move in a positive direction by crossing its previous high. However, from past two trading sessions the stock has reversed from the highs and arrived near to its support area.  It will be important to see if it bounces from here onwards to surpass its previous high of 230 levels. RSI which was in deep overbought has relieved from the zone. As shown in hourly chart, at the level of 204, there is a measuring gap which will hold prices as it will be an unfilled gap. If it manages to fill the gap then the level of 200 will act as a strong support to this stock. Any reversal from current levels will soar prices towards 235-238 levels. RSI has arrived to its center line. As per Wave theory, Prices have completed wave iii of wave c and it is moving down in form of wave iv of wave c. Once wave iv is over in between 204-200 levels, prices will move higher in form of wave v which will surpass the

Larsen and Toubro Elliott Wave Analysis

Image
 LT daily chart LT hourly chart As per daily chart, the stock is moving in a positive direction by crossing its previous high. Prices are moving in a sideways direction after a dynamic rise, this normally happens in-order to digest the recent rise. Daily RSI is also relieving from the overbought zone and can soon move back in. From hourly chart, prices are moving in a rising channel and have reversed from the resistance of it. There is a high possibility for the stock to move in a triangle pattern, only if the level of 1505 is protected on the downside, any move below this level will drag price near to its next support of the gap which comes to around 1465 levels. However, RSI is near to oversold zone and can reverse anytime soon, if prices reverse from 1505 levels. As per Wave theory, prices are moving in wave c in which it has completed wave iv and it is currently moving in wave v, in which it has completed wave iii and it is moving in wave iv (triangle pattern). Once this patter

SBIN Elliott Wave Analysis

Image
 SBIN daily chart SBIN hourly chart As shown in the daily chart, the banking stock is moving in a rising black channel and it is very obvious that the trend is firmly positive. The stock has crossed its previous high which opens further positive possibilities that it will continue to move up. To understand the strength of the current trend or rally, I have applied ADX in the lower panel which gives you a snapshot of how strong the rally is. As of now it is above 40 which clearly states that it is in mature stage and can go till 60-65 levels. In the hourly chart, prices are moving in a higher highs and higher lows formation and it has formed a measuring gap which is not filled yet. Measuring gap occur in-between the rally and remains unfilled. It also gives the target of the rally and it comes to around 460 for this banking stock. However, it is too soon to come to this target and so I think the current pattern which is on the brink to complete will help to define the target. The cont

Exide Inds Elliott Wave Analyis

Image
Exide Inds daily chart  Exide Inds hourly chart As per daily chart, the stock is moving in a higher highs and higher lows and has also given a breakout in bullish cup and handle pattern at 175. The target of the pattern comes to 225 which is measured from the depth of the pattern adding it to the breakout level. It has successfully crossed its previous resistance of 207 but has closed below it last week. Any move above 207 will be a buy opportunity. From hourly chart, prices are persisting in a rising channel formation. As far as it is within this channel the bias remains positive and prices will continue to soar incoming trading sessions. RSI has also relieved from the overbought terrain As per Wave theory, prices are moving in wave c in which it has completed wave iii in extension and wave iv lower, now it is opening wave v which will be impulsive in nature and will continue to move higher to complete wave c. The summation is Exide Inds is positively poised, a sustainable move

Tata Steel Elliott Wave Analysis

Image
 Tata Steel daily chart Tata Steel hourly chart As shown in the daily chart, the metal stock has shown strength from the support of 600-610 where the horizontal line is drawn. Also it is very visible that, prices have closed above both the moving averages without giving a bearish crossover. As far as higher highs and higher lows are intact, prices will continue to move in a positive direction and in this case it will cross its previous high. Daily RSI has crossed the center line from below thus giving buy signal. In the hourly chart, price has corrected from the recent high and is all set to soar in further sessions after bouncing from support area. However, RSI is in overbought terrain and there are high chances it might relieve from the overbought territory which can drop prices lower. Once it corrects or moves sideways it can then be bought. From Waves perspective, the stock is moving in wave 5 after possibly completing wave 4 lower. This means that in wave 5 prices will cross i

GBPINR Elliott Wave and Neo Wave Analysis

Image
 GBPINR Fut hourly continuous chart From above chart it is very clear that, prices have formed a distribution pattern which is an indication that the pair will sink going head. The pair from 100 is now trading down to 99.5/6, such dynamic fall is only possible with formation of a pattern on upside. I have found a distribution pattern which is a rising wedge, prices can dip near to its previous low which is 99, any break below this level will infuse further selling pressure dragging it till 97-96 levels over medium term. From Wave perspective, ending diagonal in wave v is evident also in wave iv we can see bow and tie diametric which has seven legs in it (Neo Wave). After wave v prices will move in corrective form which I will monitor and keep updated. Education Learn Technical Analysis in our 4 month course to help you to identify better trade setups. This course will be conducted every twice in a week for around 2 hours. This theory can be applied on all free floating markets. In this