Posts

Axis Bank Elliott Wave Analysis

Image
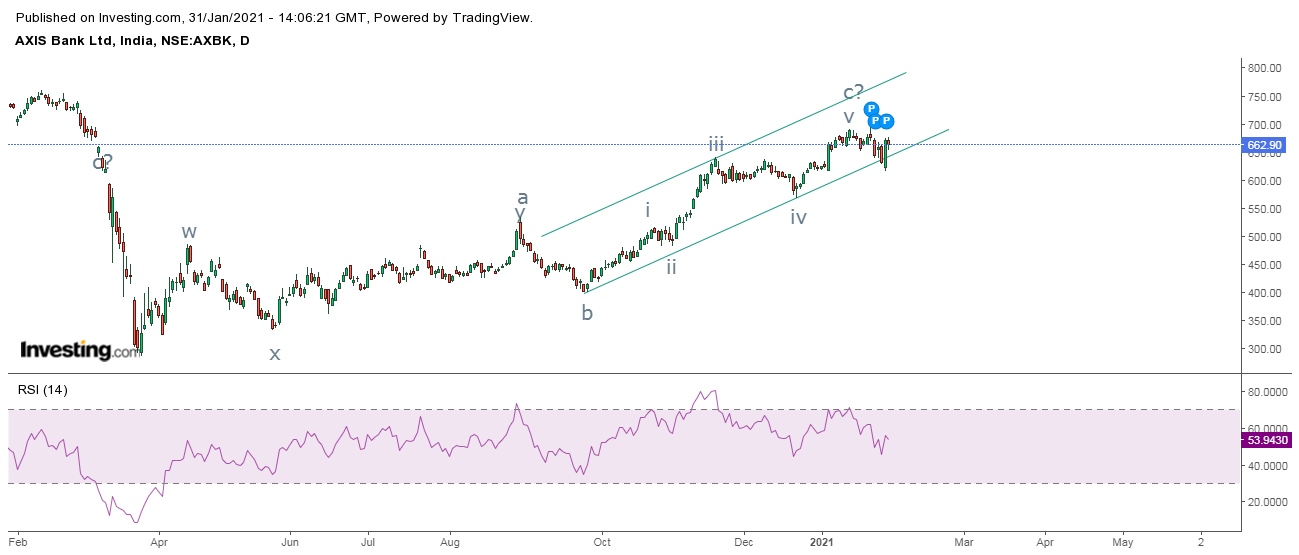
 Axis Bank daily chart Axis Ban hourly chart As per daily chart, the banking stock, tried to break the rising trend line support but quickly picked up momentum and turned higher. Daily RSI have taken support from its previous low marked by horizontal black line, indicating that prices might jump from current levels. From hourly chart, there is no discontinuation of higher high and higher lows and so as far as prices persists in the rising channel the bias is positive and can rest till its previous high or near to it. Prices can travel till 685-689 levels over short term with support at 648 (closing basis). There is still some vacuum for RSI to reach till overbought terrain. As per Wave theory, the stock is moving in wave b which looks to be a flat, irregular flat or running flat pattern. It will depend how wave b will move or much percent till will retrace of wave b as compared to wave a of wave b. At present till has retraced 80% of wave a of wave b and can move till 100% or even

Nifty Elliott Wave Analysis

Image
 Nifty daily chart Nifty hourly chart As shown in the daily chart, the index has broken the rising trend line support and it has slumped lower by taking out over 1000 points from the all time high. This was one of the sharpest reversal occurred at the top which suggests that, it is going to be difficult for the index to make new high in the span of next six months. Also the ADX (red line) which is in a matured stage is indicating that the recent uptrend is languishing. In the hourly chart, prices have arrived near the trend line support (lower rising trend line). Any move below this trend line support will infuse further selling pressure. However, failure to break this support will open the possibility for a relief rally coming in which can soar it till 14200 levels which was earlier acting as a support now resistance (polarity reversal). RSI is exhibiting positive divergence but it still needs confirmation which can only be obtained over period of time. From Waves perspective, my

SBI Elliott Wave Analysis and Technical Analysis

Image
 SBI daily chart SBI hourly chart As per daily chart, the banking stock is positively poised and it is moving in a positive trend. As of now it is trading near the important support zone. Also it has formed a rounding bottom and the target of the pattern comes to 316 levels. RSI has relieved the overbought zone and can quickly move back up from here. From hourly chart, higher highs and higher lows are intact and prices are all set to rise from current levels as far as 275 is intact on the downside (closing basis). RSI is near to the oversold terrain and can move back up from here. As per Wave theory, the stock is moving in wave v of wave c. The ongoing leg has still some vacuum to reach its target. The summation is SBI is all set to climb near till 312-316 resistance zone over short term ith support at 275 (closing basis). Education Learn Technical Analysis in our 4 month course to help you to identify better trade setups. This course will be conducted every twice in a week for

Nifty Elliott Wave Analysis

Image
 Nifty daily chart Nifty hourly chart As shown in the daily chart, Nifty is moving in a higher highs and higher lows and it is trading well above the rising trend line. On last trading day of the week, prices slumped by over 1.5% down by over 200 points but it managed to protect the rising trend line, thus taking its support. An important observation seen on RSI, it is moving in a stiff zone as marked by two horizontal lines. As of now it is taking support of it and can move back up to its resistance. In the hourly chart, the index is moving in a range of 14650/700- 14200 levels (marked by horizontal black lines). As far as price persists in this zone it will move in a sideways pattern. Also it is imperative to avoid that prices are near to an important support zone (confluence zone). RSI has reached oversold terrain and can move back up soon. From Waves perspective, I had mentioned that prices will move down in wave iv after completing wave (v) of wave iii, which can go till 14100

Nifty Elliott Wave Analysis

Image
 Nifty hourly chart In the hourly chart, the index continues to move in a highs and higher lows and it is above the rising trend line indicating that the trend is firmly positive. On the last day of the previous week, the index witnessed profit booking which dragged prices below 14500 and it closed at 14433. As far as there is no steep correction coming at the higher levels, I will firmly say that Nifty is in bull trend and will test the level of 14900-15000 levels over short to medium term. RSI has also relieved from overbought territory and can is now near to the oversold terrain. From Waves perspective, prices are moving in wave iii, which happens to be extended. Here it is either moving in wave v of wave iii or it is over which will start wave iv down. Wave iv can move till 14100 levels which will be the support of the trend line. If wave iii is still ongoing it will reverse from current levels. The summation is Nifty has a support at 14100 and can move back up till 14900-15000

UPL Elliott Wave Analysis

Image
 UPL daily chart UPL hourly chart From daily chart, the stock has just bounced from 38.2% retracement of the previous up move (240-545) and it is all set to cross its previous high thus opening positive possibilities for the stock. Also the stock is persisting above the rising trend line which indicates that the trend is positive. However, RSI has arrived near to overbought territory and it is possible that it can relieve from those levels. As per hourly chart, prices have crossed its previous high of 480 (marked by black line) which was earlier acting as a resistance, now it will act as a support (polarity reversal). RSI is also in overbought terrain and can reverse anytime. As per Wave theory, the stock is moving in wave c which is impulse in nature and can move till 61.8% of wave a to wave b which comes to 605 levels. The summation is UPL has a strong support placed at 480, as far as it is protected on the downside the stock can reach in the price zone of 595-605 levels. Learn T

Coal India Elliott Wave Analysis

Image
 Coal India daily chart Coal India hourly chart As per daily chart, the stock is under accumulation phase and has formed a rounding bottom or a bullish cup and handle pattern. However, there is still a need to get a bullish breakout, which can only be obtained once it trades above 145 levels. A sustainable move above 145 will soar prices till 180 as per the target of the pattern. RSI has relieved from the overbought terrain and can pick up momentum. From hourly chart, prices are consolidating in a range marked by two horizontal lines. The immediate support is at 140 levels, break of 140 can drag prices further till 136 levels. Also after this downfall, the stock is poised to move higher from there near till 160 followed by 180 levels. RSI is near to the oversold terrain. As per Wave theory, the stock has completed wave i and it on the brink to complete wave ii which can be a regular flat pattern, where wave c will fail and then it will start wave iii on the upside. The summation