Posts

Showing posts from December, 2019

EURINR: Next leg starts (ElliottWave)

Image
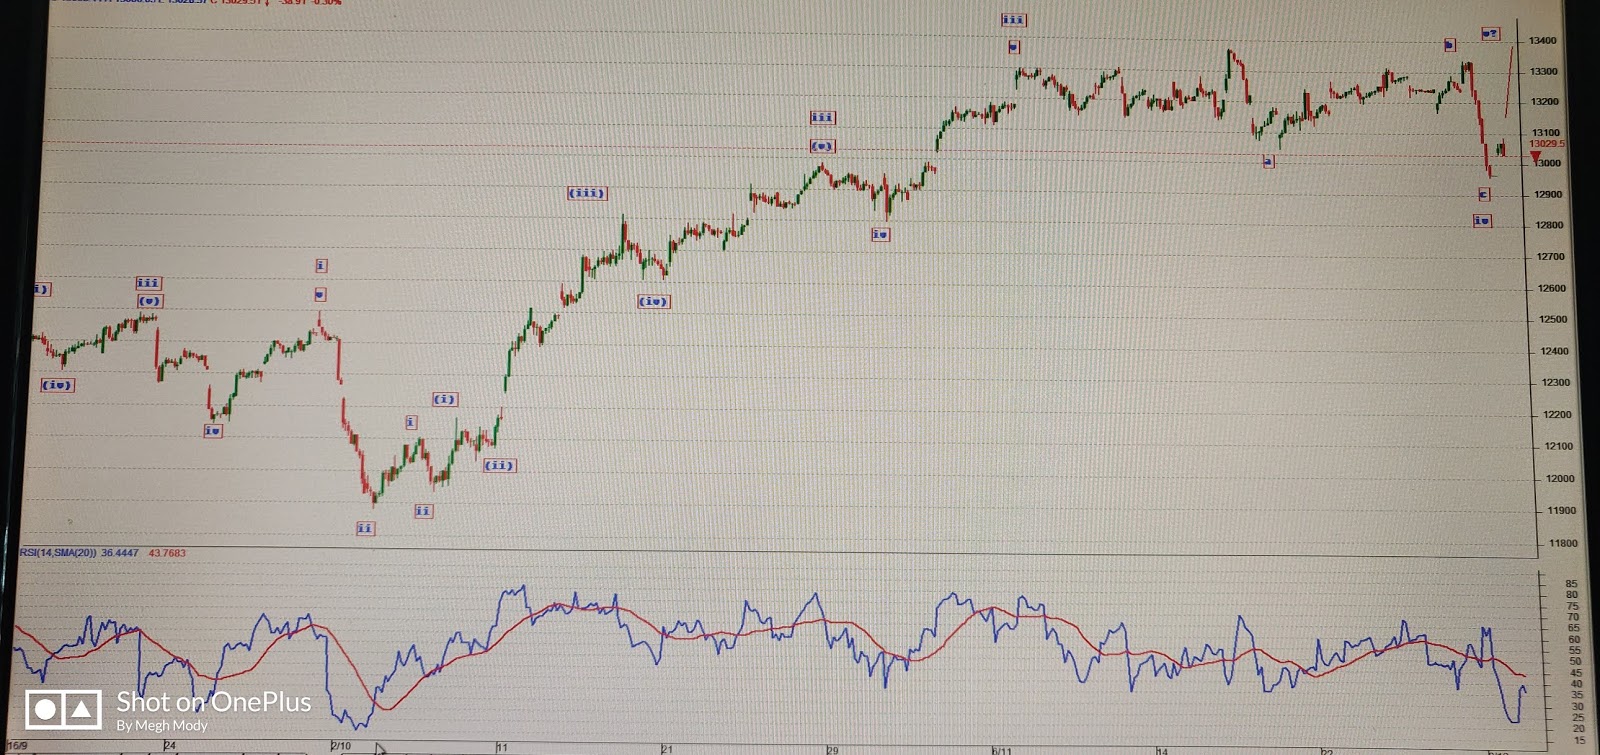
EURINR Daily chart It is to be seen that that wave c has started in which wave iii of impulse on the upside is on the way which can move till 82.60 or even higher, then wave iv on the downside can also be seen followed by wave v which can move till 84.30 levels. The level of 84.30 is 80% of previous wave a.  Learn Elliott-Neo wave in my four day classroom training/ webinar. The course fee is INR 10,000/- for registration call +919324174580.

MCX Crude Oil: Wave B in triangle?

Image
MCX Crude Oil Daily chart Elliott-Neo Wave webinar/ Classroom training is set in January 2020 for 4 days in which you will learn the theory as well as practical applications. The course fee will be INR 10000/- For registration call +919324174580 A symmetrical triangle can be seen in the above chart. Prices are near the resistance of the upper trend line. This is the last leg of triangle pattern which is wave e of wave b. Once this wave is complete Crude oil prices will slip down till 4150 followed by 3800. 

US 10 year treasury yield: Elliott Wave forecast

Image
US 10 year treasury yield daily chart Learn Elliott-Neo wave webinar/ classroom training for 4 days with me which will cost you RS. 10,000/- and will make you learn the theory and practical application of time and price. Don't follow the crowd blindly, think objectively before entering a trade. For registration call 9324174580. The above chart is the 10 year yield of US and it is suggesting that wave iv in a Slanting triangle is on the brink to complete after an extended third wave. After wave iv, wave v will move down which can drag prices lower below the end of wave iii.  If this holds true the 10 year bond which is quoting at 128 can move up till 132 in near term.

MCX Gold: Elliott Wave Forecast and extension within extension

Image
MCX Gold Daily chart Learn ElliottWave Neo Wave analysis with me in my four day course webinar/classroom training which will provide an insight about how market behaves, where it will reverse and how to catch a rally which I showed in the above chart of gold. The fees for the same is INR 10,000/- Now let us understand what is going to happen in MCX Gold. Prices have recently given a breakout and it is in wave 3 which is extension within extension as seen in the above chart. This means that wave 4 down and wave 5 higher both are pending. If everything is in place in next year Gold can test 44000-45000 

Hang Seng: Possible triangle pattern and it's Elliott Wave forecast

Image
Hang Seng (Hong Kong) Daily chart Hang Seng is Hong Kong benchmark index, which is been moving mostly in a range of 30,000- 25000. I think as far as price persists in this range no clear direction can be seen. This range can become narrow going ahead as triangle can be formed in a corrective wave. As per wave theory, wave a was in a impulse fashion. As of now from the level of 24500 to 30000 is wave a of wave b followed by wave b of wave b lower at 25000 and currently it is in wave c which has already progressed till 61.8% of wave a of wave b. There are chances for it to go till 80% too. I think 29200 is the capping for the current wave up which will start wave d down followed by wave e up which will terminate below 30100 levels. This forecasting is difficult to do but you can learn and become a ElliottWave forecaster/Practitioner in my 4 day course where I will teach you all the aspects of time and price along with entire theory with practical applications. The course f

GBPINR Elliott Wave forecast

Image
GBPINR weekly contract From wave perspective only a flat pattern can fit into the above chart where in wave wave c of wave b is pending higher which can move up till 102 levels minimum, if regular flat is then converted to irregular flat there are high chances for prices to move till 109 or even higher. Learn Elliott and Neo Wave analysis which will be a four day course. Classroom training is available and fees for it will be INR 10,000/-. Don't follow the crowd blindly think objectively and trade with the help of trade setups. For registration call +919324174580.

MCX Silver: Wave v on the way Elliott Wave forecast

Image
MCX Silver Fut Daily contract MCX Silver is showing resilience from the lower levels. many thought that the trend was changed but if you compare the hart of MCX Gold with MCX Silver, Gold is at all time high but silver has not crossed its previous high. It is difficult to say if it will cross its previous high or not but it is easy to forecast that its previous high will be crossed. From Wave perspective I have used combination of Elliott and Neo wave and came to a conclusion that prices are moving in a (a-b-c) pattern. In which at present prices are moving in wave c. In wave c which is an impulse wave prices have completed wave iv and is now set to move up in the form of wave v. This wave v can terminate near till 53000-53100 levels which is 61.8 of wave i-wave iii-wave iv. Learn Elliott Wave and Neo wave analysis in my four day course, classroom training available. For registration contact +919324174580. the course fees is Rs. 10,000/-. Technical Analysis course o

Nifty ElliottWave forecast

Image
Nifty daily chart Nifty Elliott wave wave s are very much confusing at current juncture but I just came out with one of the probabilities that showcases something very astonishing. Technically speaking, Nifty is not showing any signs of weakness as it continues to make new lifetime high. Also to be noticed that the index is protecting it's previous low, all suggesting that upside is not capped. As per wave theory, I believe that wave iv was in a inverse descending triangle which implies that currently Nifty is in wave v and is all set to move till 61.8% of wave i, iii to iv  Let us learn all these concepts of Elliott-Neo wave in my four day course which will give  you objective approach to forecast price direction. This theory can be used in all markets and helps you identify proper reversal points and catch the rally. The fees for the same is INR 10,000/-. C for registration call +919324174580 classroom  training available. 

Technical Analysis course from 5th Jan 2020

Learn Technical Analysis from the start in a classroom for 4 months and become a Technical Analyst. This will be a certified course and will be explaining all the Eastern and Western indicators in detail along with other important concepts like inter market analysis, PNF charting etc.  Don't waste time and follow crowd blindly, learn it and become a objective trader and investor. The classes are going to start from 5th Jan 2020. For registration call +919324174580.

MCX Nickel Elliott Wave forecast

Image
MCX Nickel Daily chart MCX Nickel is moving in a higher highs and higher low formation after a dynamic move down from 1300 to 960. However, it seems that the trend is now changing. As per ElliottWave, I think either wave I/ a is formed followed by wave ii/b lower 1009 and now what it is witnessing is wave iii/c. If it is wave c I am expecting it to go till 1084 and if it is wave iii it can go till 1129 which is 161.8% of wave i to wave ii. In short the bias is purely positive for Nickel as it can move till 1085 to 1129 in near term.

Elliott-Neo Wave lec to start from 21st Dec 2019

Elliott-Neo Wave lecture to start from 21st December 2019. This will be a 4 day course and will be teaching you all the important concepts, patterns and much more on this theory. The fees will be 10000/- INR or $155. Minimum 10 students in a batch. The course can be taken on webinar or classroom training. For registration call +919324174580.

Japan Nikkei- Anticipated happened

Image
Japan Nikkei anticipated on 17th September 2019 Japan Nikkei Happened on 13th December 2019 Learn Elliott Wave and Neo Wave in my four day webinar or classroom training which will give you a indepth understanding of price reversal and capturing the trend. Stay ahead of the crowd. The fees for the same is INR 10,000/- for registration call +919324174580. Here is the link for when the ndex was anticipated in September 2019 check out https://www.marketanalysiswithmeghmody.com/2019/09/japan-nikkei-3-3-5.html

German DAX: Anticipated Happened and Elliott Wave Forecast

Image
German DAX 60 mins chart In my earlier article on German DAX written on 3rd December, I had mentioned that wave 5 or v is pending on the upside which can surge price near to 13400. The index on 13th Dec opened with a gap up and made a high of 13423 and quickly filled the gap which can also termed as an exhaustion gap- Anticipated Happened. Here is the link for German DAX written on 3rd Dec https://www.marketanalysiswithmeghmody.com/2019/12/german-dax-elliottwave-5th-wave.html After wave 5 or wave v there is a high possibility for prices to correct, here by using Elliott Wave counts I have come to a conclusion that the index can test 12900 in near term.This fall will be corrective in nature and will find support near wave iv or wave 4. After exhaustion gap there are hgh chances that the current rally is on the brink to fade. This entire analysis is easy to understand but difficult in practice, but you can practice with me by learning Elliott-Neo Wave analysis which i

USDINR: Re-visited and Elliott Wave Forecast

Image
USDINR 60 mins chart In my previous article on USDINR I had mentioned that prices are not here to move up from current levels but will reverse and move down till 71-70.9. My wave counts were slightly change but my view was very much the same. I had a doubt and had mentioned that something else will be in making which exactly happened. Here is the link https://www.marketanalysiswithmeghmody.com/2019/11/usdinr-detailing-with-help-of-elliott.html From wave perspective my view was down and was confident in reaching till 71-70.9, prices made a low of 70.6. It came close to its previous low and is now showing signs of reversal. The entire wave ii was completed in complex correction (w-x-y) and it seems that wave iii will now start and can reach till 73-73.5 odd levels by next quarter. My view now is firmly bullish for this pair. Learn Elliott and Neo Wave with me in my four day webinar or classroom training and understand the theory along with practical applications. The

Hindalco: Elliott Wave Forecast and Inverse Head and Shoulder Pattern

Image
Hindalco daily chart In my last article on Hindalco, I had mentioned that it will move down in the form of wave ii which was ongoing. Now since wave ii is over and wave iii has started, there are high chances that prices will surge from current levels. Here is the link of the article https://www.marketanalysiswithmeghmody.com/2019/11/hindalco-elliott-wave-forecast.html An inverse Head and Shoulder is also been seen where the bullish breakout is seen as prices closed above the neckline (black horizontal line) with reasonable volumes. The target of the pattern comes to around 245 odd. Currently the CMP of this metal stock is at 208 levels. As per wave theory, prices have completed wave ii and is all set to break the resistance line to move up in the form of wave iii. Now if wave iii is equal to wave i to wave ii then it will come to around 223 levels where the trend line resistance is placed. If wave iii is 161.8% of wave i to wave ii then it can move till 245 levels w

German DAX: ElliottWave 5th wave

Image
DAX hourly chart From the above chart, DAX is moving in a higher highs and higher lows. Yesterday, the index plunged by over 2% which enabled all the market participants in a panic mode. My question is will this be considered as a reversal? From advance technical analysis I have place ElliottWave counts which signals that the index will soar from current levels. The real reason is market is moving in an impulse fashion in which it completed wave iv down. Now it opens wave v higher which can near till 13400 levels. This analysis is needs practice and practice and practice to become master. You can learn Elliott-Neo wave in my paise webinar which is for 4 days. The fees for the same is INR 12500/-. For registration call +919324174580.