Posts

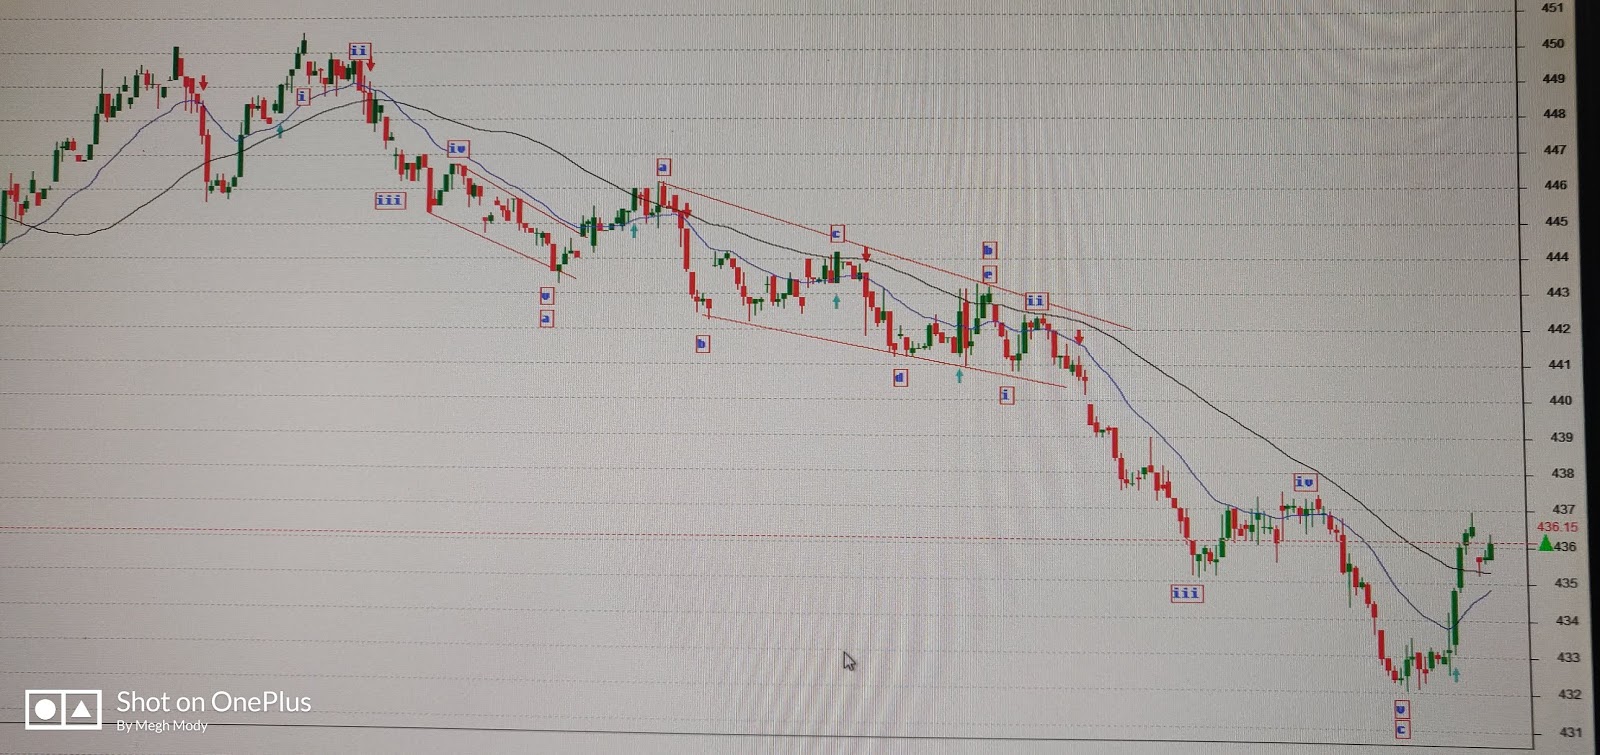
MCX Copper: Elliott Wave Slanting triangle
Image
MCX Copper 60 mins Dec chart From Elliott Wave perspective, MCX Copper completed one bigger corrective wave (a-b-c). In wave wave five Waves are seen and it also terminated near to 161.8% of wave a to wave b. Wave b in the above chart formed a Slanting triangle which is unique and not seen often.  Not so long ago, I had written an excerpt on MCX Copper in which I had mentioned that it will come down near till 420 levels which can be utilised to buy for the level of 470-475 levels. Check this link to view the excerpt. https://www.marketanalysiswithmeghmody.com/2019/10/mcx-copper-all-set-to-soar.html Learn Elliott-Neo Wave, a 4 days webinar/classroom training in which entire theory along with practical application will be explained. The fees will be RS 12500/-. For registration call +919324174580

New rates for the courses offered

Image
Hello guys!!            I am delighted to announce that the rates of the course offered is been slashed. Earlier the rates for Technical Analysis course which is over 3 months course and Advance Technical Analysis which is 4 days course can also be altered in to 2 days was RS.15000/-.  Now for Technical Analysis course the fees have slashed down to 13500/- and for Advance Technical Analysis it is RS 12500/-. For registration call +919324174580

MCX Crude- Revisited

Image
MCX Crude Anticipated on 3rd November 2019 MCX Crude Happened 23rd November 2019 In my previous update dated 3rd November 2019, I had mentioned that Crude will soar till 4200-4300 based on Elliott Wave forecast. If you want to see the excerpt, check the link https://www.marketanalysiswithmeghmody.com/2019/11/mcx-crude-to-surge-till-4200-4300.html Now it has faced the resistance of 4200 but the real question is will it fade out or continue to surge, to to know the answer you can join in my classroom training of Elliott and Neo Wave which will for 4 days and the fees will be INR 12500/-. To register call +919324174580

MCX Nickel- Revisited

Image
MCX Nickel Daily chart Anticipated on 19th November 2019 MCX Nickel Daily chart Happened on 26th November 2019 From what I have anticipated on 19th November, prices have been moving precisely the same way as you can see from the above chart. Many base metals are under performing, Nickel is one of them. Now since the move is over or ongoing the coming forecast of prices is not shown. To see the link of 19th November for Nickel click on the link https://www.marketanalysiswithmeghmody.com/2019/11/nickel-elliottwave-forecast.html I will be discussing this chart in my coming classroom training session. Be a part of it of this 4 day course in which entire Elliott Wave and Neo wave theory along with practical applications will be explained. For registration call +919324174580

Elliott-Neo Wave Classroom training to start soon

Image
Check out this video The fees for the 4 day course will be 12,500/- and for registration call on +919324174580

USDINR: Detailing with help of Elliott Wave

Image
USDINR Continuous contract Daily chart I with help of Elliott Wave came with a conclusion that USDINR is on the way back to test its previous lows. This is my first scenario and will stay and will be my favorite among-st two. The first scenario is- The recent high of 72.30 was where wave b ended marked by a circle and so wave c on the downside is still pending which can tumble near to its previous lows. Many argue that the recent formation in this pair is a triangle and so need to mark (a-b-c). However, it can also be marked as (w-x-y-x-z) and so on to complete wave ii. This means that wave iii, wave iv and wave v is pending down. I have marked wave b at 72.30 is because it has retraced 80% of the previous wave a. If I mark wave b at wave a shown in a square then it can not be valid. So wave wave b is marked by (a-b-c) and completed by showing circle. The second scenario is- Many practitioner is showing that wave iii has started but I doubt. If it has starte

Tata Steel Re-visited

Image
Tata Steel 60 mins chart In my previous update on Tata Steel, I had mentioned that there is a pending leg up which can go near till the ed of wave iii and that is exactly what has happened. if you want to read my previous excerpt you can by clicking the below link https://www.marketanalysiswithmeghmody.com/2019/11/tata-steel-elliottwave-neowave-forecast.html  As per Wave theory, prices probably completed wave v up or it is still ongoing. I will not be giving a clear cut direction in this stock but you can as I have already anticipated the move which is either over or ongoing. You can learn Elliott Wave and Neo Wave with me which will be a 4 day course and the charges will be Rs. 12500/-. Grab this golden opportunity by registering on +919324174580.