Posts

Showing posts from December, 2021

MCX Crude Oil Anticipated Happened and Elliott Wave Analysis

Image
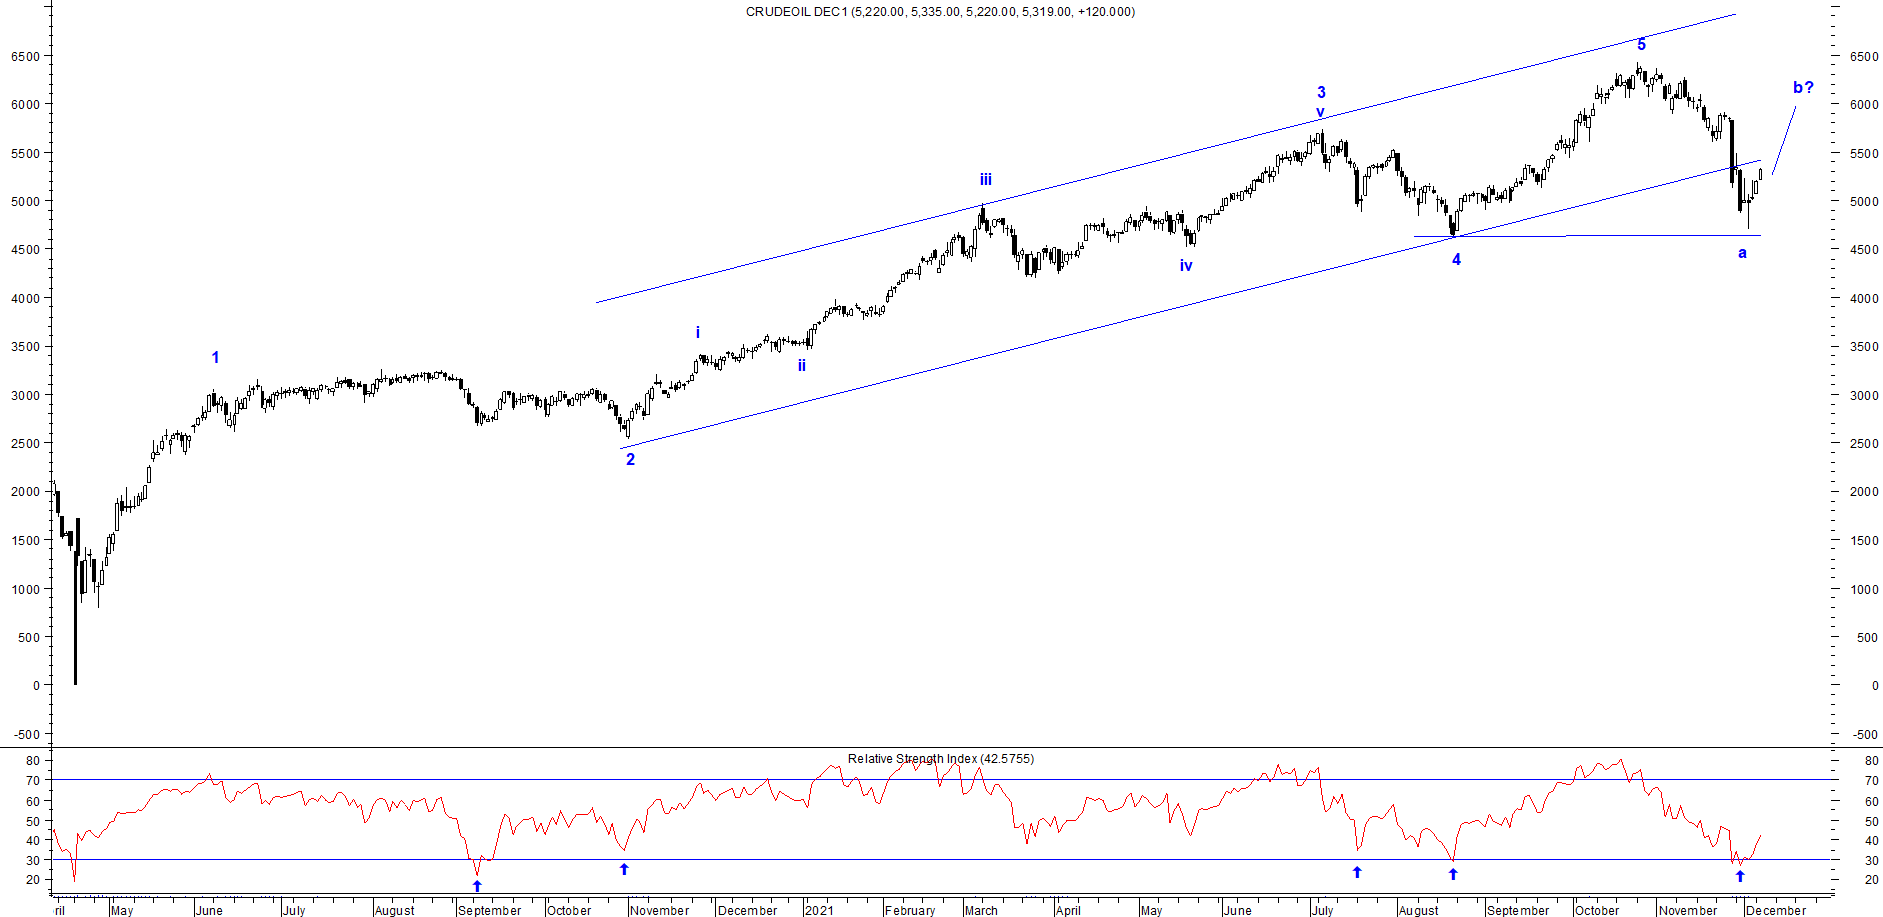
 MCX Crude Oil daily continuous contract Anticipated on 7th December 2021 MCX Crude Oil daily continuous contract Happened on 27th December 2021 From the above chart, MCX Crude Oil which was trading at below 5500 in the first week of December 2021, I had mentioned that, "  MCX Crude Oil is all set to test the level of 5700-5800 over short to medium term as far as 5000 levels are protected on the lower side." - Anticipated Happened. Crude Oil touched 5700 on 27th December 2021 thereby achieving my first target. To read the previous article on MCX Crude Oil, you can click on the link here https://www.marketanalysiswithmeghmody.com/2021/12/mcx-crude-oil-elliott-wave-analysis.html As per Elliott Wave theory, I have counted the recent rally as wave b which can be a flat, the minimum criteria of flat is at 6100 which will eventually turn into normal flat pattern followed by irregular. My next target after it surpasses 5800 will be 6100 followed by 6400. The summation is MCX Crude i

Nifty Bank: Elliott Wave Analysis

Image
 Nifty Bank hourly chart As shown in the above hourly chat, prices have given a bullish break in a falling channel which is a positive sign and can move higher from current levels. Currently it is facing the resistance near the rising channel, which I think will be taken out in couple of trading sessions. From Waves perspective, prices have completed a corrective wave (a-b-c) and has opened another corrective wave which is likely to move higher from current levels. In the ongoing wave, it has completed wave a and wave b and in wave c it is done with wave i and probably wave ii this opens wave iii higher followed by iv and v . The summation is Nifty Bank is expected to test 40000-40400 levels over short to medium term with support placed at 36000.

Nifty: Elliott Wave Analysis

Image
 Nifty hourly chart As shown in the above hourly chart, prices are moving in a lower highs and lower lows and are moving precisely in a falling channel. It is imperative for prices to break the falling channel to open positive possibilities. It has broken the small falling channel and is sustaining above it, which opens that the index might reach towards its next resistance. By applying Wave theory, prices have completed first correction (a-b-c). This opens the possibility that it will either open wave x which will terminate near 17600-17700 and then tumble thus opening double correction. The second possibility is that it will eventually convert into flat pattern which can move till 18200-18500 (minimum). The summation is Nifty is expected to move higher from here which can find resistance near till 18200-18500 levels over short term with support placed at 17230 levels.

MCX Copper: Elliott Wave Analysis

Image
 MCX Copper hourly continuous chart As shown in the above hourly chart, a sideways move is seen in red metal and it will continue to do so as there is a high possibility for the metal to test its resistance. The range in which it is moving is 720-750, so it is likely that 750 is likely to be tested. From Waves perspective, prices are moving in wave b and it is currently moving in wave c of wave b in which it is forming wave iv and wave v is pending. The summation is MCX Copper is likely to test 750 levels over short term with support at 726.

MCX Crude Oil: Elliott Wave Analysis

Image
 MCX Crude Oil daily continuous chart From the above daily chart, it is crystal clear that prices are moving in a higher highs and higher lows and are all set to move higher as per the traditional technical analysis. However, it is difficult to know that how much high it can go from current levels if you do not know the advance technical analysis. As shown in the chart, prices has found support near its preceding low marked by (4)/ (horizontal line) and from there it is showing sighs of reversal. A candle stick has also formed a long legged, indicating buying at lower levels. As per Wave theory, prices have completed 5 impulse waves starting from level where it went below 0 (price). It took almost one and the half year to complete one impulse cycle and now it has started corrective pattern where it completed wave a and it is all set to soar in form of wave b. The summation is MCX Crude Oil is all set to test the level of 5700-5800 over short to medium term as far as 5000 levels are pro

USDINR : Change of trend (Part2) and Elliott Wave Analysis

Image
 USDINR Spot daily chart anticipated on 15th November 2021 USDINR Spot daily chart anticipated on 26th November 2021 (Part 1) USDINR Spot daily chart happened on 6th December 2021 From the above chart, I have been continuously saying that the correction is bound to be over once the level of 74.7 is taken out which can soar prices till 75.5. This is what I had mentioned for USDINR (Spot price), " USDINR is all set to move higher from here and can reach till 75.5 over short term once the level of 74.7 is crosses decisively." On 6th December 2021, prices made a high of 75.47 which completes my target of 75.5 thus again helping me to achieve the impossible by applying Elliott Wave Theory. To read the previous article on USDINR you can click on the below link  USDINR : A Completion of Corrective Pattern  https://www.marketanalysiswithmeghmody.com/2021/11/usdinr-completion-of-corrective-pattern.html USDINR : Change of trend (Part 1) https://www.marketanalysiswithmeghmody.com/2021/1