Posts

MCX CRUDE OIL: Anticipated Happened ElliottWave forecast

Image
MCX Crude oil Anticipated on 31st Dec 2019 MCX Crude oil Happened in last week of January 2020 In my previous update I had mentioned that Crude oil is on the brink to fall when it was near to 4400-4500 levels. This you can check in my below mentioned link all you have to do is click on it. https://www.marketanalysiswithmeghmody.com/2019/12/mcx-crude-oil-wave-b-in-triangle.html Coming back to this article now, prices were then supported after a air strike by US on IRAN but it was short lived which made the black gold tumble back again. I had mentioned about triangle but was not sure, but now I am as this will not be a triangle and so I have marked w-x-y pattern. After this pattern was over prices came to my mentioned level in the above link which was 4150 followed by 3800.  Learn Elliott Wave and Neo Wave in my 4 day webinar/classroom training. Cost for the same is RS.10,500/- or $155. For inquiry contact +910324174580. You can also subscribey YouTube channel

AUDUSD ElliottWave forecast

Image
Weekly chart of AUDUSD Form the above chart I can see that five Waves down is over and prices are now poised to move higher from current CMP. Well it is early to say that this can be a reversal or a fresh leg up, I think wave b is in making which will not go above 61.8% of previous down wave. In this case I am expecting that prices will move up till 0.80 now. Learn ElliottWave NeoWave, a four day course for you all. Webinar and classroom training is available. The cost will be RS. 10500 or $155. For inquiry call +019324174580.

Egypt EGX30: Elliott Wave Forecast

Image
EGX30 Weekly chart From the above chart, prices are moving in a inverse ascending triangle and is all set to tumble down. This inverse triangle will not exceed 61.8% of its previous wave, which means that the previous wave was wave a and current ongoing wave is wave b and wave c is pending down. This wave c lower will complete wave iv of wave iii in a zigzag pattern. One this zigzag pattern is over wave v of wave iii will start which can soar prices near till 190000 levels. As wave iii is extended one so all the internal waves will be similar to wave i and wave ii. In terms of wave iv of wave iii it can be 61.8-161.8% of wave a. However, 161.8% is unlikely as it will overlap wave i of wave iii so 61.% of wave a to wave b will end wave c and wave iv of wave iii around 110000. Learn Elliott Wave and Neo wave in my 4 day course a classroom training and webinar, the cost will be Rs. 10,500/- or $155. For inquiry call +919324174580.

Dubai DFMGI: Elliott Wave Forecast

Image
DFMGI Weekly chart From the above chart, I have come to a conclusion that DFMGI is all set to start a fresh leg up in form of an impulse wave as it has completed wave (a-b-c) and it now moving up in form of wave (i-ii-iii-iv-v). In which it is likely that wave i looks to be expanding leading diagonal pattern, once that is complete wave ii will dip close to 61.8% of wave i followed by wave iii higher. My target for DFMGI will be 3800-4000 levels as it completes wave iii of wave i at one higher degree. Learn Elliott Wave and Neo wave with me in my 4 day course (webinar/classroom training). The cost will be Rs. 10,500/- or $155. For inquiry contact +919324174580.

ISRAEL TA35; Elliott Wave forecast

Image
TA35 weekly chart TA 35 an index of Israel is moving in a higher highs and higher lows by taking support of the earlier resistance. the overall picture is compelling and prices are poised to move up going ahead. Any dip can be utilised as a buying opportunity. From wave perspective, prices are moving in a fifth wave extension there are chances for fifth wave extension within extension. As of now I am giving a level of 1900 for the index to conquer. Overall the trend is firmly positive. Learn Elliott Wave and Neo wave with me in my 4 day course webinar/classroom training for Rs, 10,500/- or $155 for inquiry call +91924174580.

OMAN MSM30 Elliott Wave Forecast

Image
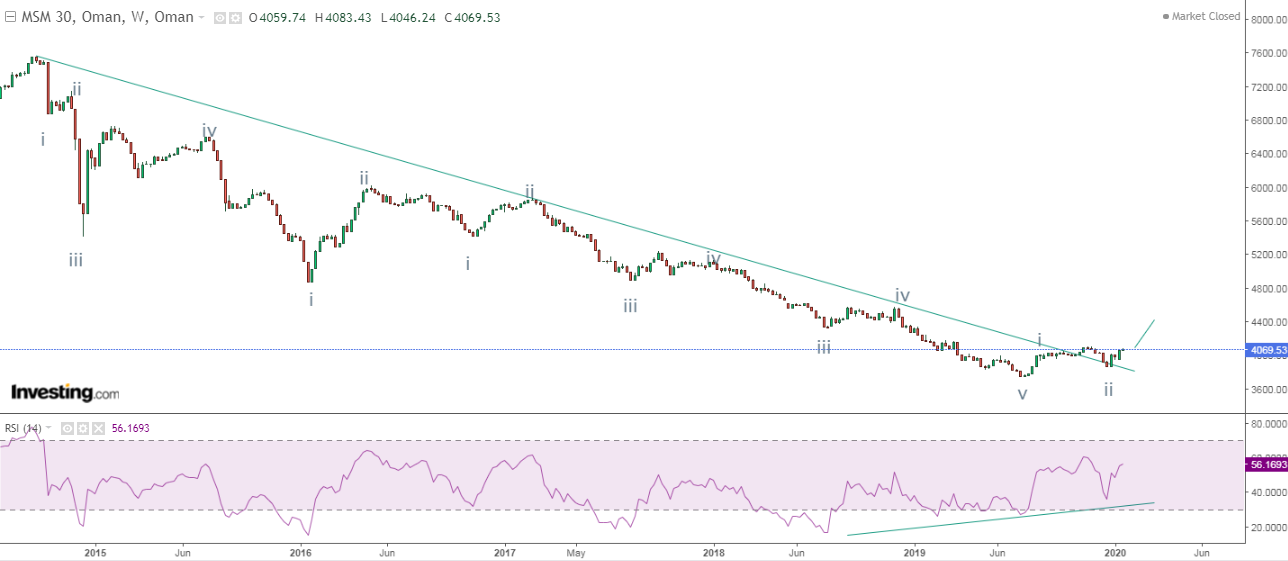
MSM30 Weekly chart MSM30 is an index of OMAN and is all set to soar in coming weeks. This index is now positively poised and can move up dynamically after a bearish trend line break. At this juncture, prices are above the trend line even after the throwback. This means that a dip in price is also a buying opportunity. RSI on weekly chart has exhibited positive divergence which means that negative momentum is cooing off. As per wave theory, prices have completed wave C in a five wave structure (i-ii-iii-iv-v) which means now there are high chances that prices will reverse. For short term I am expecting 4400 for this index to reach. Overall for long term perspective, prices can move up and start new leg after (a-b-c) pattern of wave 2 at one higher degree is done. Learn Elliott wave and Neo wave in my 4 day webinar or classroom training. This course will teach you indepth analysis of how markets perform. The cost of the webinar/classroom training wil be Rs, 10500/- or $155

Turkey ISE100 Index Elliott Wave Forecast

Image
Monthly chart of ISE 100 (Turkey) Learn Elliott Wave and Neo Wave in my 4 day webinar o classroom training for the cost of Rs 10500/- of $155. For inquiry call +919324174580. After forming wave a and then wave b in a triangle pattern, prices are all set to move up in an impulse in which it has completed wave i followed by wave ii and currently it is moving in wave iit can move above  which can be longest wave and remember it is a monthly chart which means it can move above 1,30,000-1,35,000 mark.