GBPINR Expanding Diagonal and Post Impact
GBPINR 5 hour chart
 Analysis
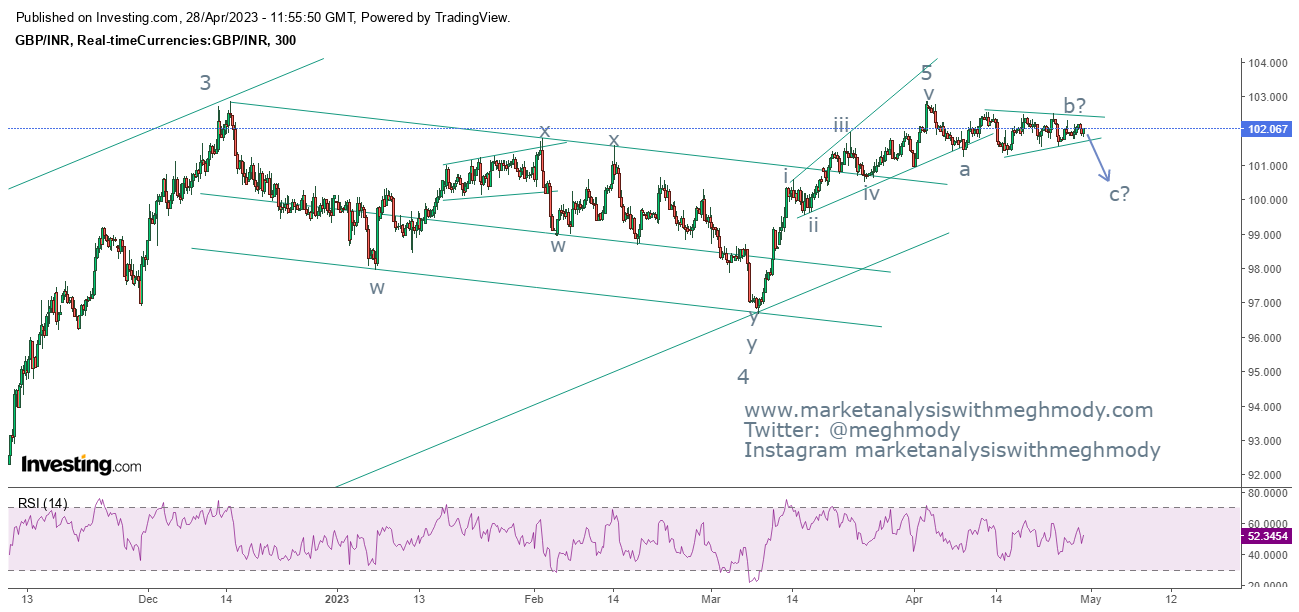
As seen in the above chart, prices are moving in a sideways action with
the range narrowing in between 102.30-101.80 levels. As far as prices are moving
in this range, no trending move is expected. This narrowing range opens the
possibility of a triangle pattern which is expected to complete once the extreme
moves mentioned above is taken out.
From Waves perspective, prices are moving in a corrective pattern (a-b-c) where it moved down from the highs of 102.92 and made a low of 101.26, where wave a was completed, followed by wave b which is in process of making a symmetrical triangle pattern (a-b-c-d-e) and then wave c lower which can falter in the range of 100.50-100.00 levels.
The summation is GBPINR is negatively poised and can plunge in the range of 100.50-100.00 levels over short term.
Join my Telegram Channel : https://t.me/elliottician1
Join My Twitter handle : https://twitter.com/meghmody?


Comments