Posts

GBPINR: Ending Diagonal in making

Image
 GBPINR  5 hour chart Analysis From above chart, GBPINR continues to move in a higher highs and higher lows and has been consolidating above the falling channel. As far as prices are trading above the level of 00 the bias remains positive for the pair. RSI has also relieved from the overbought terrain and can move back up going ahead.   As per wave theory, the pair is moving in 5 th wave and can continue to move higher. I think that it will form an ending diagonal pattern which will make this pair move in a range of 102-103 levels and then the counter wave will start. The summation is GBPINR has limited upside left which can make this pair move in a range of 102-103 levels.

Nifty Anticipated Happened

Image
 Nifty daily chart Nifty 2 hour chart Analysis In my previous update I had mentioned that, " Nifty is expected to tumble now in the range of 17000-16800 over short term with the strong negative bias." The index made a low of16850 thereby achieving my level- Anticipated Happened To read my previous article on Nifty, click on the below link https://www.marketanalysiswithmeghmody.com/2023/03/nifty-elliott-wave_11.html As seen in the above daily chart, prices are moving precisely in a falling channel which is a negative sign. However, the index has arrived near to the support of the channel and it is likely that the benchmark can show signs of bounce back. ADX continues showcase that the downside strength is optimum. From 2 hour chart, prices are forming a reversal pattern at the bottom but as of now there is no price confirmation to it which makes this pattern not feasible. On the higher side the benchmark has a crucial resistance of 17305, if that is taken out then the entire p

Nifty Bank- Anticipated Happened

Image
 Nifty Bank daily chart Nifty Bank 2 hour chart Analysis In my previous update I had mentioned that, " Nifty Bank is negatively poised and can tumble towards 39600-39500 levels over short term. My medium term targets are still intact which I have mentioned in my earlier updates." The index tumbled well below the expected level and marked a low of 38598 levels. - Anticipated happened. To read my previous article on Nifty Bank, click on the below link https://www.marketanalysiswithmeghmody.com/2023/03/bank-nifty-wave-c-to-start.html As seen from the daily chart, prices are moving in a lower highs and lower lows but at current juncture, the index has arrived near to the support of the falling channel. However MACD continues to exhibit negative signal but on the short term time frame there are many reasons for not going further short. From 2 hour chart, prices are consolidating near to the support of the channel, also it is forming an inverse head and shoulder pattern near to thi

Punjab National Bank - Elliott Wave Counts

Image
 PNB 2 hour chart Analysis From the above chart, prices are moving in a lower highs and lower lows and is moving precisely in the falling channel. Recently it has arrived near to the support of the channel where the RSI has also been exhibiting positive divergence. As per Wave theory, the stock has completed wave a of one higher degree and has opened wave b in which the last leg of wave b which is wave c is pending on the higher side which can go till 50-51 levels. The summation is PNB can show a bounce back from the support levels towards 50-51 levels over short term.

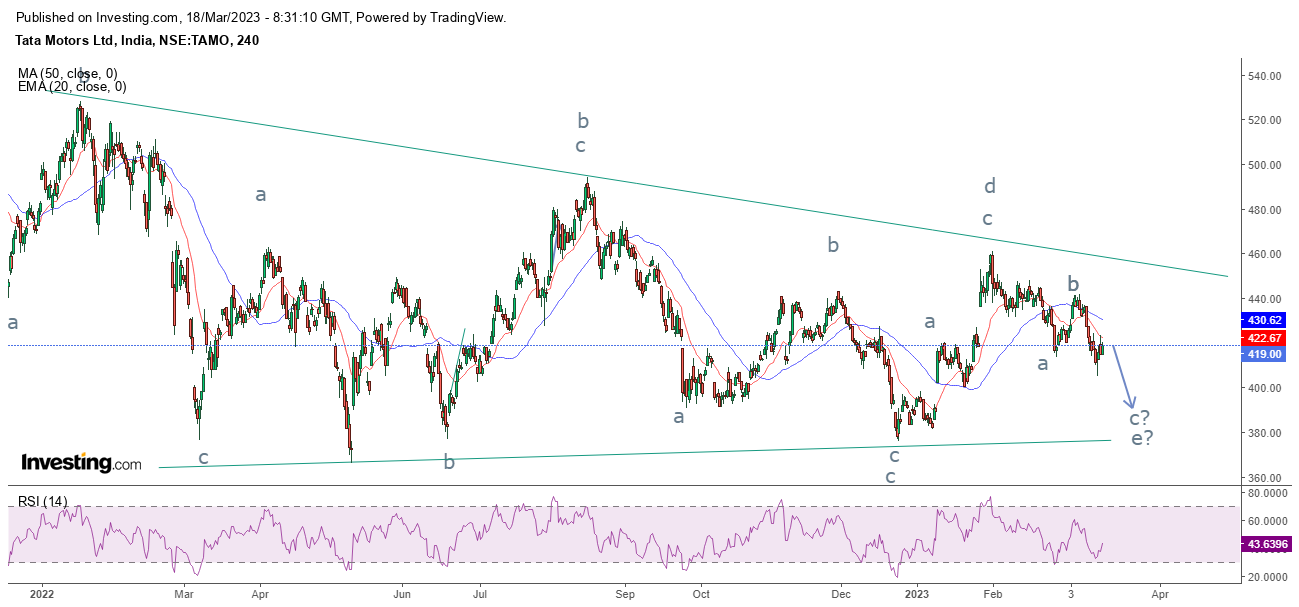
Tata Motors last leg of the triangle

Image
 Tata Motors 4 hour chart Analysis As seen in the above chart, prices are consolidating in a stiff range of 440-410 levels. As of now the stock has arrived near to the support of the range and can move higher from current levels. It seems that the stock might not move till 440 levels but can test 430 levels which will then make the stock plunge towards 400-390 levels. RSI is in oversold terrain and can relieve from this zone. Wave theory suggests, prices are moving in the last leg of the symmetrical triangle pattern where the current fall is likely to move towards 390 levels. It is also likely that prices might not test the lower trend line of the triangle which is a part of Neo Wave limiting triangle possibility as prior there are 4 touch points. The summation is Tata Motors might go up towards 420-430 levels and then eventually will move down till 400-390 price range.

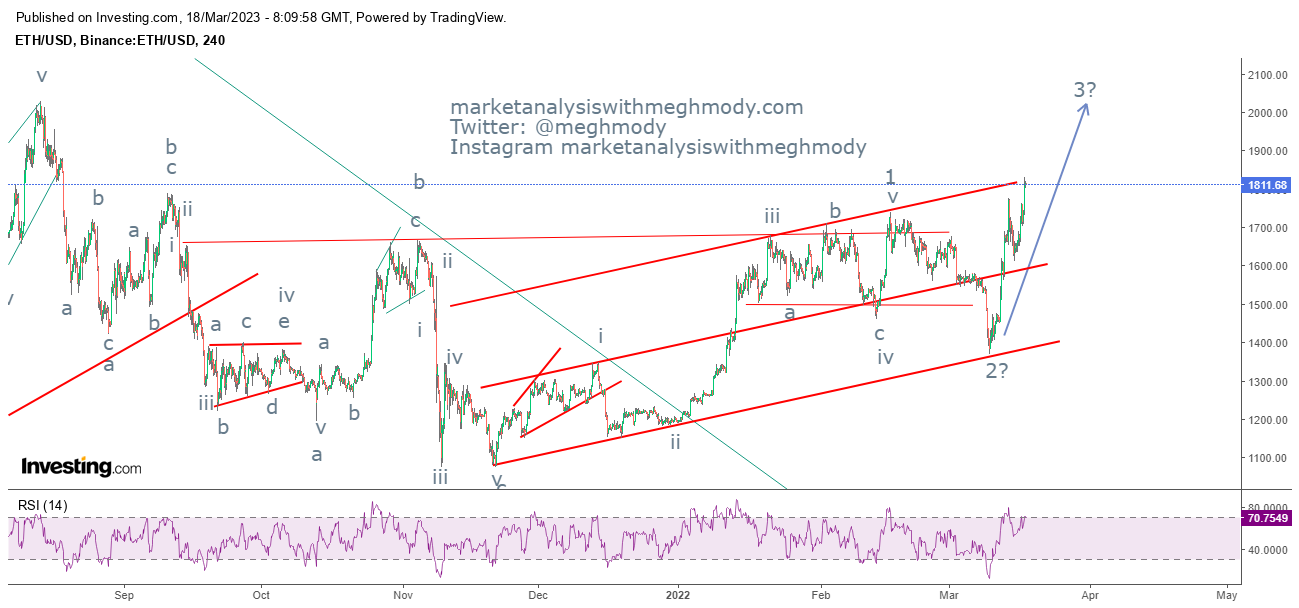
Ethereum: 3rd Wave started

Image
 ETH 4 hour chart Analysis As expected, prices have completed wave 2, though it tumble more than expected but eventually completed by forming a higher bottom and then crossing its previous high thereby confirming higher highs and higher lows and changing the trend from negative to positive. In my previous update I had mentioned that prices will complete wave 2 and wave 3 will open up, to read my previous article click on the below link https://www.marketanalysiswithmeghmody.com/2023/03/ethereum-wave-2-in-motion.html From Waves perspective, prices are moving in a rising channel and has started wave 3 higher which can go till $2000-$2200 levels over short term. The summation is ETH is likely to test the levels of $2000-$2200 levels over short to medium term.

EURINR- Sideways action expected

Image
 EURINR 2 hour chart Analysis As seen in the above chart, prices are moving in a sideways direction primarily in between 87-89 levels. Last week the pair plunged from the top of 88.60 and came back down towards 87 levels. It is not very obvious that it can go back up to test 88.50- 89 levels. According to Wave theory, prices are moving in a flat pattern where it has completed wave a followed by wave b lower which was the last week low and then trying to move higher in the form of wave c which can possibly be in an ending diagonal pattern. Another scenario can be, prices are moving in wave b of wave b as wave a was a steep fall so the current upmove can be wave b of wave b and then wave c on the lower side which can complete wave b then wave c higher. In both the above scenarios there is a high possibility for the pair to go higher towards 89 levels going ahead. The summation is EURINR has a crucial support of 87.00 on the lower side and can move higher to test 89.00 over short term.