MCX Silver: W=Y
MCX Silver Daily chart
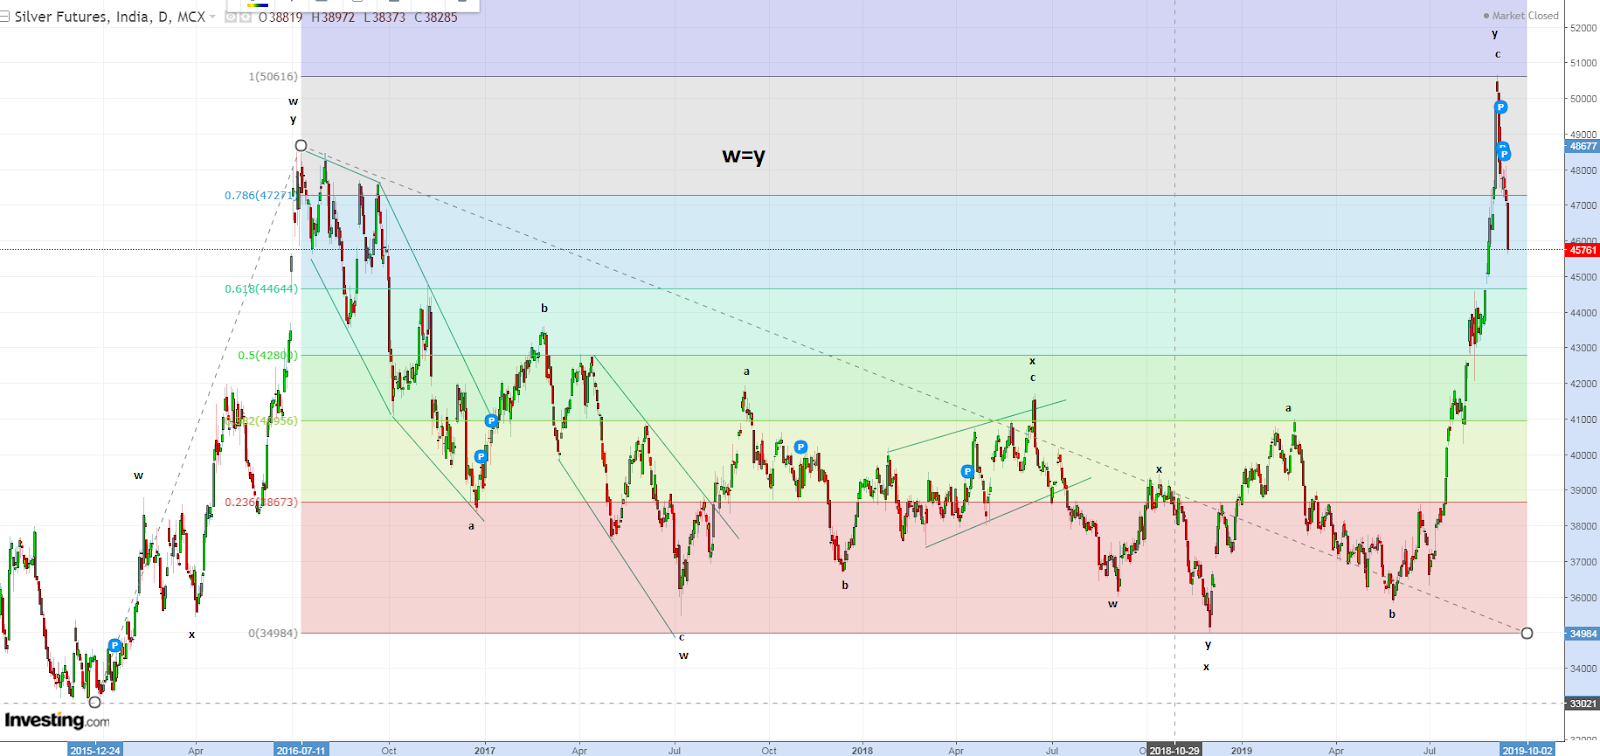
From the above chart, it is self explanatory that prices have shown a reversal at the top. This top of 51000 odd was a Fibonacci resistance which I will be explaining you later. Currently in the weekly chart Silver has made a reversal candle known as shooting star pattern and has also given a confirmation last week by tumbling almost 1300 points on a single day i.e on Friday.
As per wave theory, I have marked my waves and shown in the above chart. I think that the top is in place and Silver is most likely to falter in coming week. The entire formation is a complex correction pattern where I have marked (w-x-y) and within that it can be seen as a w-x-y pattern. The best thing is that wave w at the highest degree in the above chart is equal to wave y which is 100% of wave w. This is an important resistance zone as the entire (w-x-y) pattern is a regular flat pattern.
Lear Technical Analysis to forecast and catch reversals. Elliott Wave and Neo Wave Webinar is scheduled on 21st and 22nd Sept. A two day webinar which will be running for more than 15 hrs covering important concepts of Elliott and Neo Wave. The fees for it will be 15000/-.
Don't follow the crowd blindly, use and combine traditional technical tools and advance technical analysis to understand an objective trade setup. For registration you can mail me meghmody@gmail.com or call me 9324174580.


Comments