MCX Crude Oil: Revisited
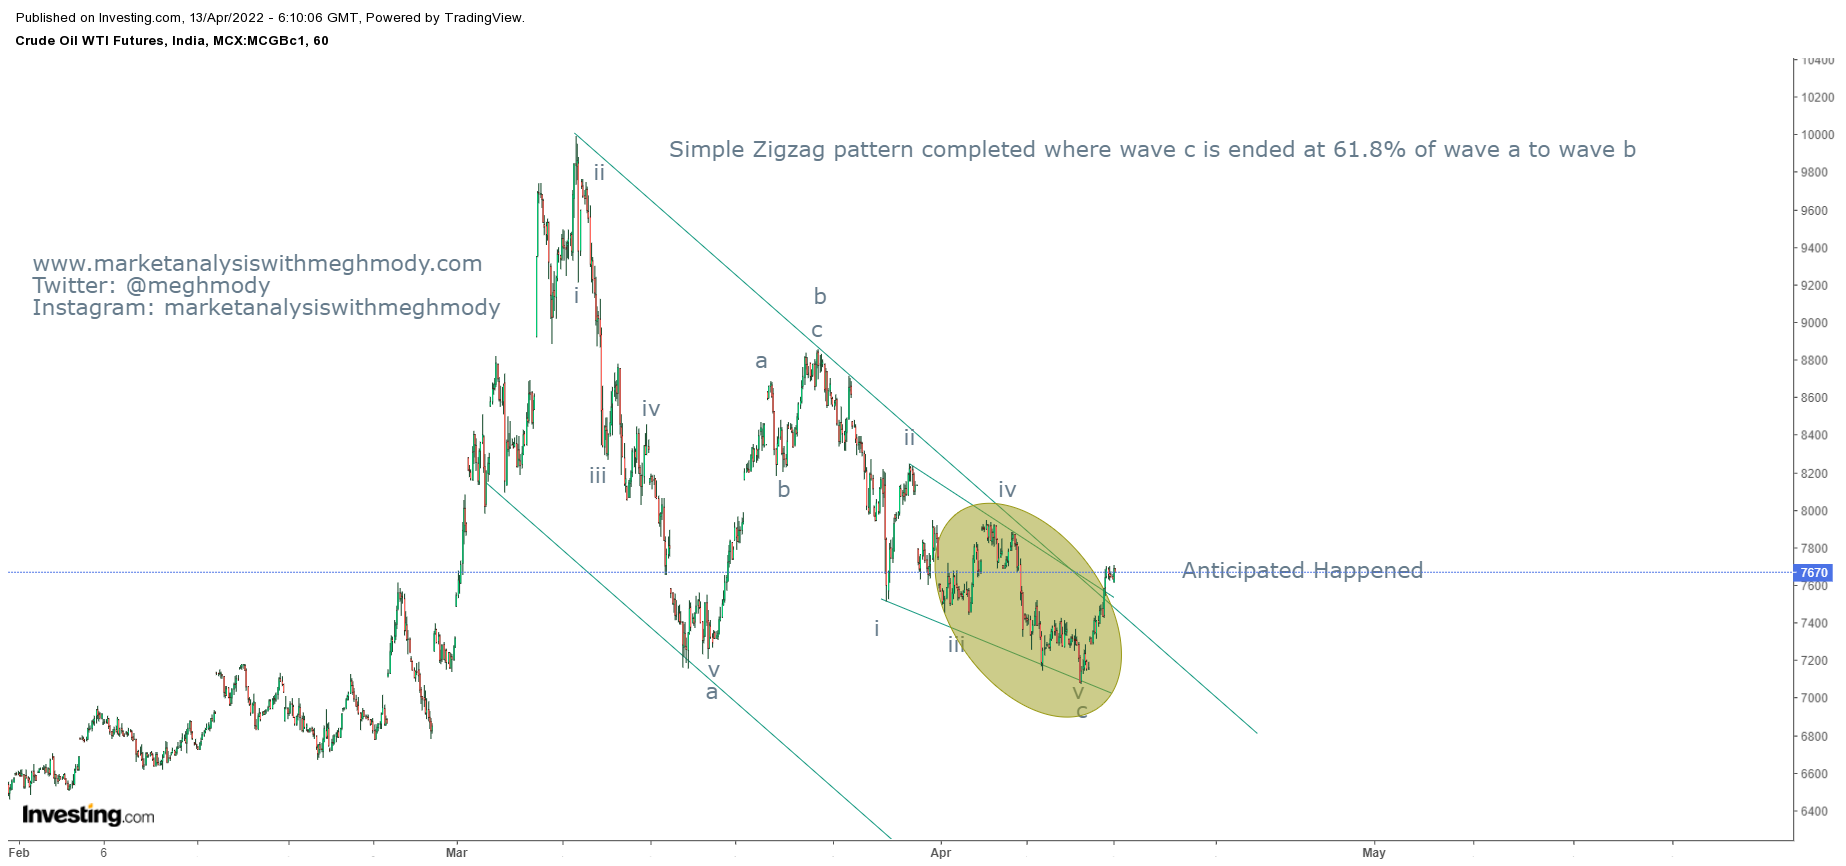
MCX Crude Oil 60 mins chart happened on 14th April 2022
In my previous update on MCX Crude Oil I had mentioned that, "MCX Crude Oil is set to soar near till 7950-8000 levels over short term."
Prices after giving a bullish break continued to soar and achieved my mentioned level of 7950-8000 levels on following day - Anticipated Happened
I had following the MCX Crude Oil chart and applied Elliott Wave on it and was highly successful in anticipating the fall along with the rise. To view my articles on MCX Crude Oil, click on the below link
MCX Crude Oil Anticipated Happened
https://www.marketanalysiswithmeghmody.com/2022/04/mcx-crude-anticipated-happened.html
MCX Crude Oil: Simple Zigzag pattern
https://www.marketanalysiswithmeghmody.com/2022/04/mcx-crude-oil-simple-zigzag-elliott.html
As now the trend for the black gold is firmly positive, I will continue to monitor the prices of crude oil to understand if it is impulse or corrective. I have marked wave i/a for the current up move which can complete anytime soon thus opening wave ii/b on the lower side.
I will keep all my readers updated on the unfolding of MCX Crude Oil waves.


Comments