MCX Crude Oil: Simple Zigzag Elliott Wave Analysis
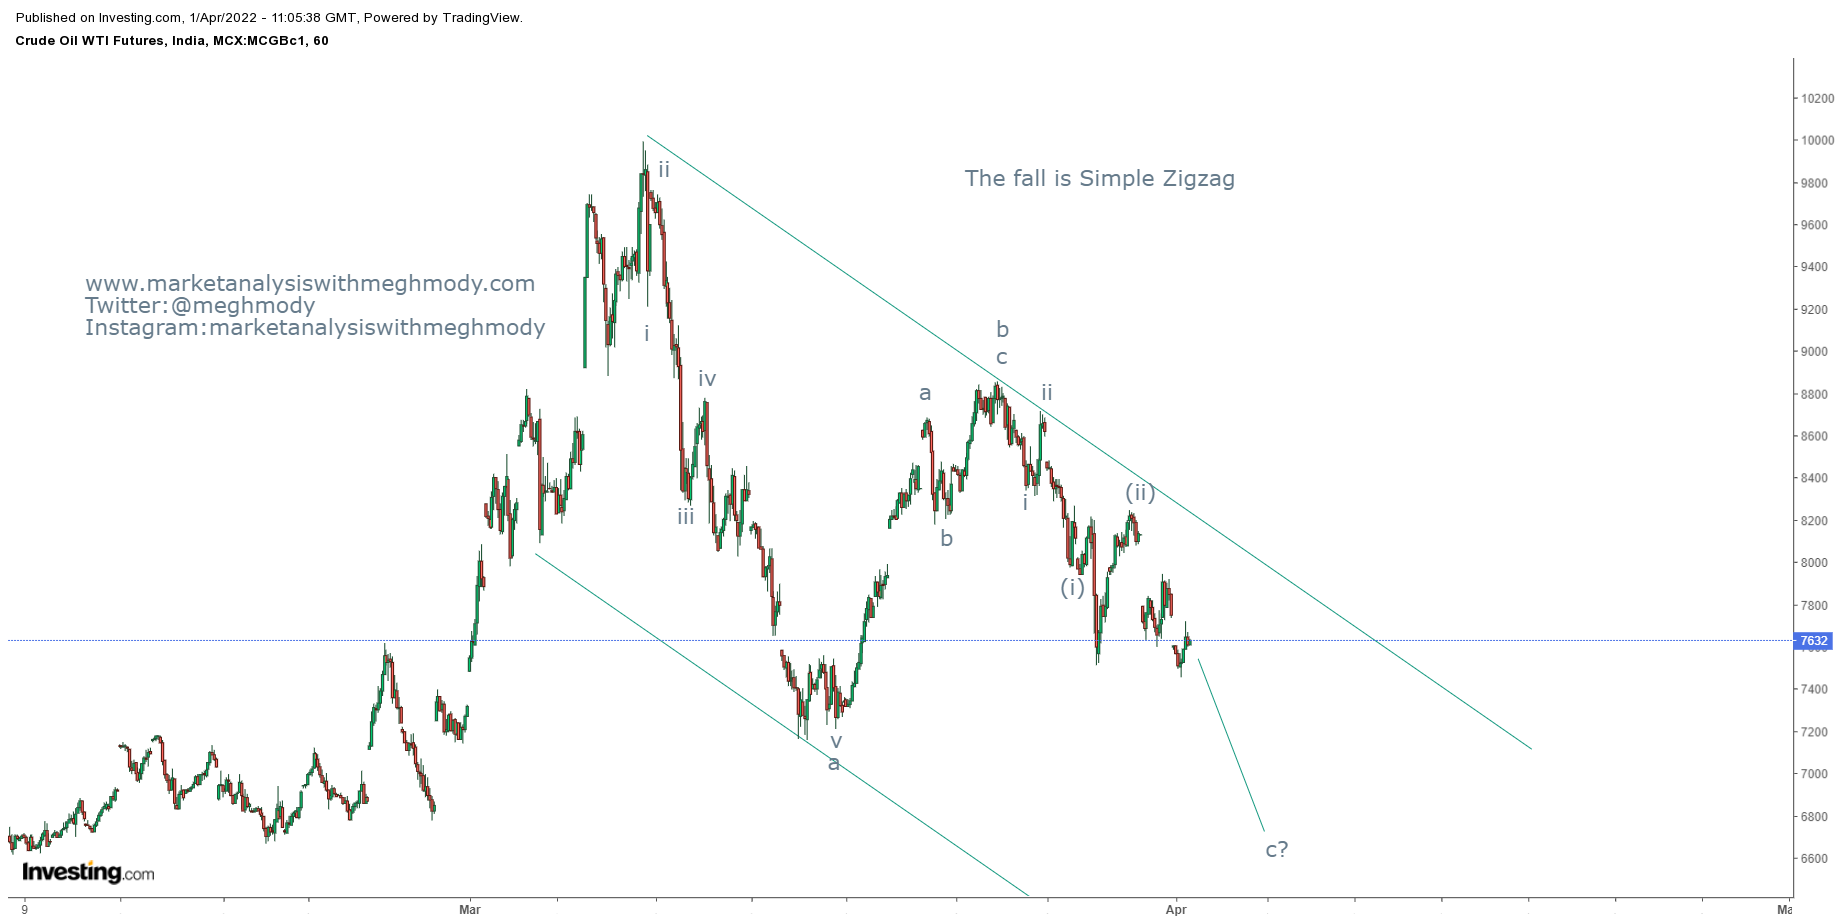
MCX Crude Oil 60 mins chart
Prices after moving up till 9990 levels on the back of ongoing conflict between Russia and Ukraine has now shown a relief. It looks like a major top is in place and the Crude Oil is set to plunge going ahead.
As of now, prices failed to cross its previous high which discontinues higher highs. It is imperative to see if prices break its previous low.
Wave theory suggests, the commodity is moving in a simple zigzag pattern, where wave a is impulse followed by wave b which ended just below 61.8% and no wave c which looks to be impulse and can end up in between 61.8-161.8% of wave a to wave b.
The summation is MCX Crude Oil can test the level of 7155 followed by 6620 levels over short term.


Comments