Hindalco: Bearish Head and Shoulder pattern and Elliott Wave Analysis
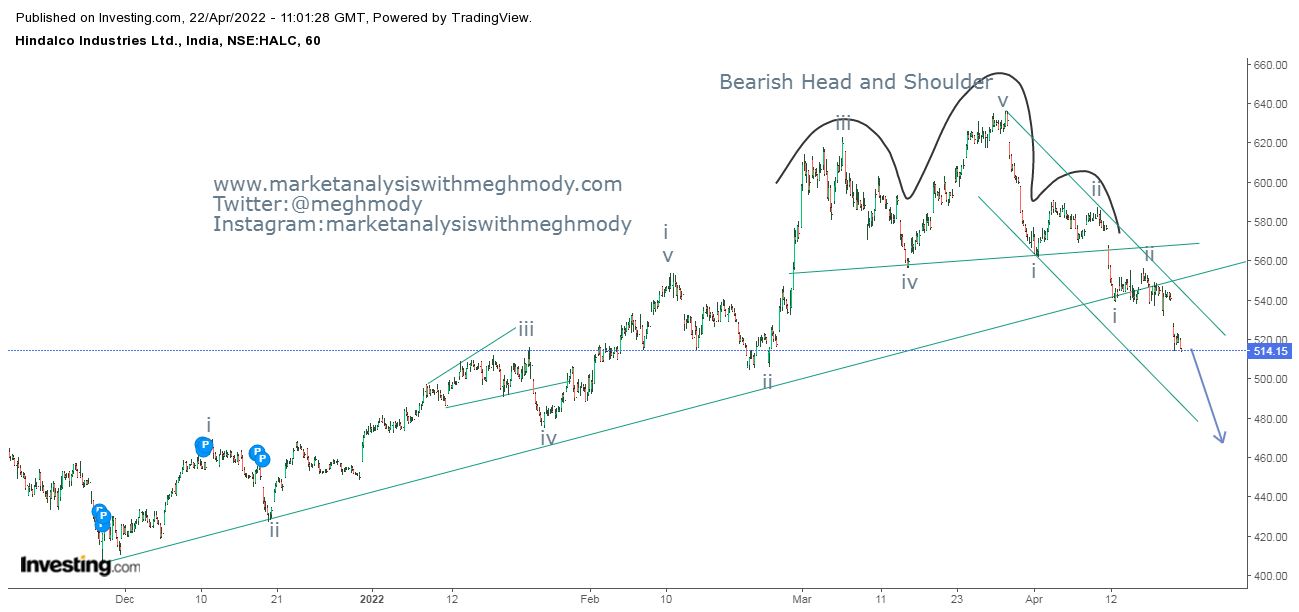
Hindalco 60 min chart
As shown in the above chart, prices are moving in a lower highs and lower lows thereby breaking the rising trend line after forming a topping process or distribution process on the top. This distribution pattern is a well known pattern of traders known as Bearish Head and Shoulder pattern. The target of the pattern is the depth of the head and the right shoulder will act as a stoploss level.
From Waves perspective, prices are either moving in wave a-b-c or what I have marked as impulse where wave iii is extended. Here wave iii of wave iii has started and it will continue to falter till the support of the falling channel.
The summation is Hindalco is negatively poised and can plunge till 480-460 levels over short period of time.


Comments